September 24, 2025
 Articles
 Newsletters
 Videos


In October 2008, one of the world’s leading pioneers in the field of vision testing and research was invited to a meeting in England to discuss the vision standards being applied by the World Blind Cricket Council (WBCC). Dr. Ian L. Bailey accepted the invitation, which opened the door to this breakthrough in low vision testing.
The Berkeley Rudimentary Vision Test (BRVT) – About its Development and its Applications.
By Ian Bailey, Emeritus Professor of Optometry and Vision Science; University of California, Berkeley
I began my career as a low-vision clinician in 1972, and right from the start, I rejected the common clinical practice of counting fingers (CF) and using hand motion (HM) as the way to test visual acuity when the patient’s vision is too poor to be measured with the usual acuity charts. The testing procedures and the visual tasks involved in the CF and HM tests were neither well-defined nor well-controlled. In the early days, my preference was to bring a Bailey Lovie visual-acuity chart, or sometimes a Feinbloom chart, very close to the patient when I could obtain a visual acuity score based on the combination of the viewing distance and the size of the letters that were read. It is somewhat embarrassing for me to acknowledge that it was not until 2007 that I gave serious attention to the measurement of very poor visual acuity.
My attention to measuring very low vision was triggered by my friend and colleague, Hasan Minto, a Pakistani optometrist when he invited me to join an Advisory Committee on Vision Standards for the World Blind Cricket Council. We met in Brighton (UK) in October of 2007. Visual acuity was used as the WBCC’s primary vision criteria for classifying their visually impaired cricketers. Our committee was asked to review their WBCC classification criteria and the various testing procedures that were being used. One of the classification criteria then being used by the WBCC and most other blind sports organizations was “unable to recognize a human hand at any distance”. It was immediately obvious that there was some need for change.
Two weeks later, I was one of about 40 invitees to attend a meeting that Art Jampolsky organized at the Smith-Kettlewell Eye Research Institute (SKERI) in San Francisco. The meeting was called “Visual Prostheses: Toward Standards for Outcomes and Their Evaluation.” Most of the exploratory research being done with early visual prostheses used CF and HM results as the primary outcome measure. Michael Bach, a German vision scientist, had already developed the Freiburg Acuity and Contrast Test (FrACT) (1996, OVS, 73, 49-53), and he made it universally available as a free download.
The FrACT is a battery of computerized vision tests that offers several different optotypes, variable contrast, and tests of more basic vision functions, and it has a sound computerized psychophysical methodology for determining thresholds.
A couple of years previously, I had been involved in testing children at Schools for the Blind in Malawi, and I was acutely aware of a need for vision tests that were very simple, easily portable, did not require access to electricity or batteries, and could be used by almost anyone in almost any environmental conditions. Immediately after the SKERI meeting concluded, I put together a PowerPoint program that used Single Tumbling E’s (STE’s) and square wave gratings as visual acuity targets. To test more basic vision functions, I included some targets with large white areas against black backgrounds. Our testing protocol had the display screen at presented two viewing distances – one was equal to the height of the screen, and the other was 4 times the screen height. There was
an initial set-up procedure to avoid shape and size distortions. A week later, this new PowerPoint routine was being used in the UC Berkeley low vision clinic, but we were well aware that we needed something simpler and more efficient. The PowerPoint file contained 40 Single Tumbling E’s (5 different STEs at each of 8 different sizes), and there were 12 square wave gratings ( 4 each at 3 different spatial frequencies). There were also 12 targets for the more basic visual localization
tests.
At the longer viewing distance, the PowerPoint STE test gave a visual acuity range of logMAR 2.00 to 1.30 (20/2000 to 20/400) in increments of 0.1 log unit. With the closer viewing distance, the range became logMAR = 2.60 to 1.90 (20/8000 to 20/1600). The grating acuity test was only performed at the closer viewing distance, and there were only 3 sizes logMAR = 2.90, 2.60, and 2.30 (20/16000, 20/8000, 20/4000). We liked this PowerPoint test. It gave nice results, but it was extremely slow and clumsy. We wanted a visual acuity test with the targets printed on cards and did not require electrical power or batteries.
At this time, Jonathan Jackson from Belfast was visiting Berkeley on sabbatical leave. Over the next year, Jonathan and I spent countless hours cutting and pasting, making multitudes of square and rectangular cardboard panels with various optotypes and patterns printed in different sizes. We experimented with many different combinations and sequences. In the Low Vision Clinic, Robert Greer, Marlena Chu, and I experimented with different combinations of these cards and panels. Hasan Minto was in Pakistan, and we regularly consulted with him. Gradually, our group reached an agreement on some fundamental principles; we made our choices of targets and sizes. This new test is called the Berkeley Rudimentary Vision Test (BRVT).
The basic principles were:
Limitations of the acuity range with letter charts?
There is a limit for measuring visual acuity on charts of letters or other optotypes. The logMAR chart design from Bailey and Lovie (1976) standardized the visual acuity task using 5 letters per row, a logarithmic size progression, and proportional spacing. There should be minimal variation of legibility within the family of optotypes. The patient’s task on such a chart is to read across the rows of letters.
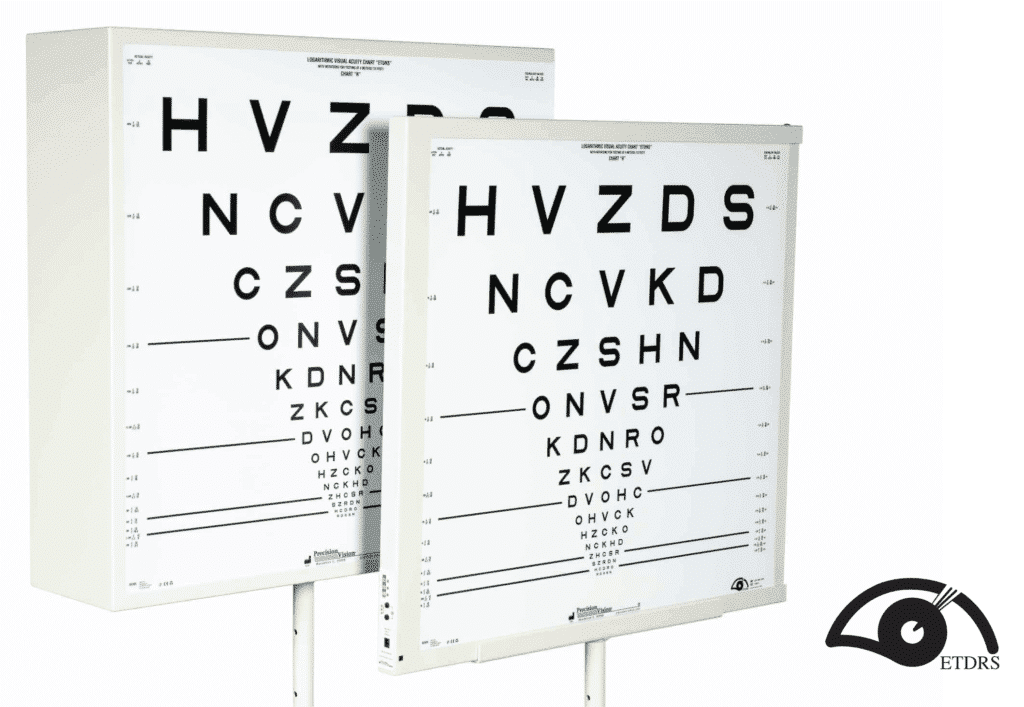
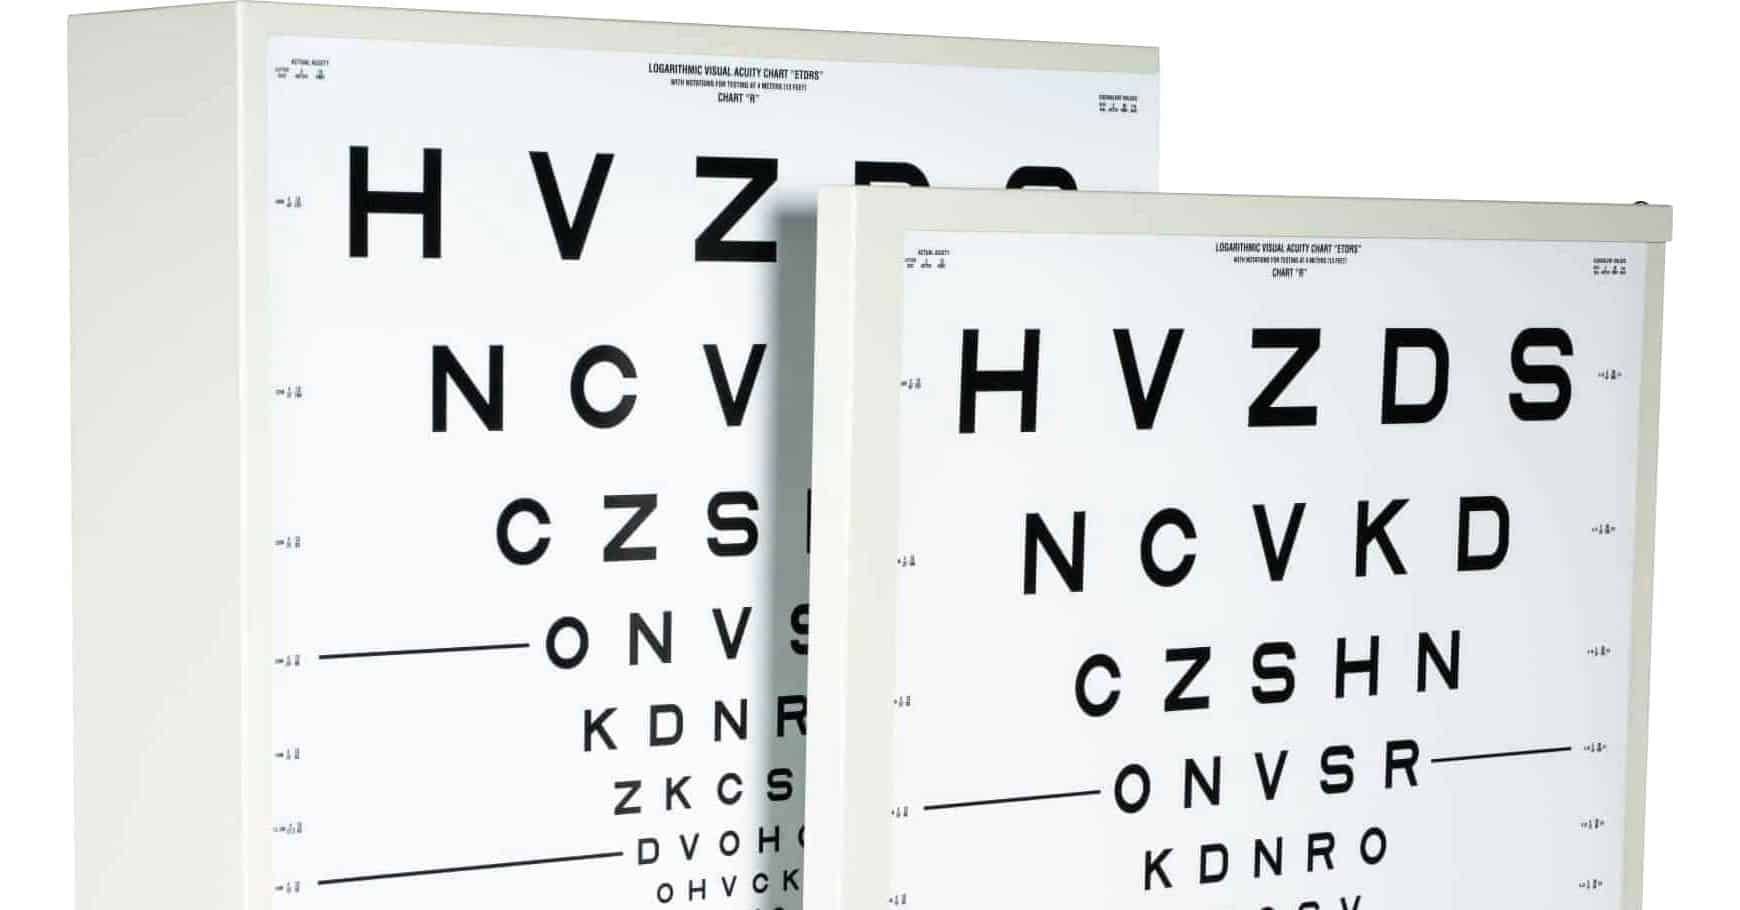
The ETDRS chart (1982) uses the logMAR principles and has a 4 meter testing distance with the Sloan letter family as the optotypes. The ETDRS chart has become the universal “gold-standard” for serious measurement of visual acuity. At 4 meters the top row of the ETDRS chart has letter that are art the level of logMAR = 1.0 (20/200 or 6/60), and the top row subtends an angle of about 7.5°. When the patient is unable to read across the top row, the chart should be moved to a closer distance so that the angular size of the letters becomes larger. We consider that 1 meter is the closest distance at which the ETDRS chart should be presented. At 1 meter, the top row subtends an angle of about 30° degrees (±15°). Any wider, and observers are likely to employ head turns and
body twists to read from one side of the chart to the other. Also, at 1 meter, there is a 3.5% difference between the distance from the eye to the edge of the chart and to the center, and this is marginally worrisome. At one meter, the top row with its 40M letters has a logMAR value of 1.60 (20/800, 6/240).
A technical but significant point is that the top row does not have any letters above it, so it presents a slightly different task. Its letters are less embedded or cluttered. So, strictly speaking, the limit of letter chart visual acuity that can be measured with an ETDRS chart at 1 meter is reached when the patient is unable to read any letters of the second top row. That is, the visual acuity should be better than logMAR = 1.60 (better than 20/800 or 6/240). It is often recommended that when the chart is placed at 1 meter, a +0.75D lens be used to maintain the best optical focus. It is extremely unlikely that such fine differences in focus would have any impact on the ability to recognize very large targets (20/800, 6/240)). When the patient cannot read the top of a logMAR chart at 100 cm, the visual task should then be made simpler.
SIMPLIFYING THE VISUAL ACUITY TASK
Visual Acuity with Isolated Single Optotypes
Using single optotypes was the natural choice for a visual task that is simpler than reading a chart of optotypes in the logMAR format.
While Sloan letters are the most favored optotypes for logMAR charts, it would be cumbersome to use isolated Sloan letters. This would require 10 different letters at each size level. For Landolt Rings and Tumbling E’s, only one optotype is required at each size level, and they can be rotated to give different orientations (usually 4) that the patient is required to identify. The Landolt Rings and the Tumbling E’s are familiar and well-accepted optotypes. We consider that the Tumbling E is the better choice of the two because it is a more complex target. With the Landolt Ring, when its size is close to the threshold, the observer does not actually see the gap but rather perceives a small blob or spot that is not quite symmetrical. From the perceived asymmetry, the observer may infer the location of the gap in the ring. There is more complexity in the Tumbling E, which is constructed with three parallel limbs and a crosspiece. At the threshold, the Tumbling E target appears as a small square-ish blob, and the observer’s task is to identify any patterns, irregularities, or features that help identify the orientation of the Tumbling E target. One can never tell what features are being used. How much of a clue comes from the parallel limbs? Does the crosspiece make the blob darker on one side? Do the ends of the 3 limbs create some irregularity on one side? The complexity of the Tumbling E task seems more like the complexity of reading letters when the size is close to the threshold. For example, if the observer is trying to make a choice between two relatively similar letters (say H and N), what irregularities or asymmetries within the blob provide critical clues to the identity of the letter from which the blob was derived?
We chose the Single Tumbling E’s as the single optotype. We decided that the largest target should be at a visual acuity level of logMAR = 2.60 (20/8000, 6/2400). This angular size is achieved with a 100M letter E (14.5 cm high) viewed when from 25 cm. Then, the E subtends about 30°. When the patient cannot read the largest STE at 25 cm, the visual task needs to be made simpler.
Visual Acuity with Gratings
Square wave gratings were the obvious choice for a simpler test target. Gratings have a long tradition in visual acuity measurement. Like optotypes, the fundamental structural elements are closely spaced with black and white lines. But, unlike optotypes, the visual task of recognizing the orientation of the lines of the grating, the observer does not need to restrict attention to a specific region or to analytically construct a coherent shape. Control of fixation is more or less irrelevant. The observer’s visual task is simply to recognize that somewhere within the display field, there are some stripes with a particular orientation. Are there any stripes or lines anywhere? Are they horizontal or vertical? It does not matter whether the stripes being detected are close to the observer’s point of visual attention or whether they are seen with peripheral vision. It is easy to understand how patients with substantial central vision loss often have great trouble identifying letters (or other optotypes), but they can have relatively little difficulty in recognizing the presence and orientation of a grating somewhere within a large display. The coarsest grating included in the BRVT has two black and two white stripes, and each stripe is 6 cm wide (subtends 14°at 25 cm). One black-white cycle is 28°. The finer gratings have proportionately more stripes.
When the coarsest of the gratings is presented at 25 cm, it has a visual acuity value of logMAR = 2.90 (20/16000, 6/4800 ). If the patient is unable to identify this grating, the measurement of visual acuity is terminated. Testing continues with tests of more basic vision functions.
Basic Vision Function Tests.
One test is for white field projection (WFP). There are two large display fields (52° square). One display panel is black with a white quadrant; the other panel is half black and half white. The observer’s task is to identify the location of the large white area. Both cards should be presented in 4 different orientations.
The other test is for Black-White Discrimination (BWD). Again, there are two large 25 cm square cards at a viewing distance of 25 cm. One card is all black, and the other is all white. The observers’ task is to tell whether the card is black or white.
SOME PRACTICAL CONSIDERATIONS
Card Size
If the visual acuity targets are going to be on printed cards, how large should the cards be?
We chose to make all the test cards the same size – 25 cm (10 inches) square. Having the test cards all the same size makes handling them a little easier, and the 25 cm dimension makes them easily portable. Mainly for mathematical convenience, we had decided that 25 cm should be the closest recommended viewing distance, and the 25cm cards could become a convenient measuring tool for checking this short eye-to-chart distance.
Sizes of the Visual Acuity Targets
There were competing pressures. We wanted to cover a large range of possible visual acuity scores; we wanted the size increments to be reasonably small, but we did not want to have many cards.
Single Tumbling E’s
We chose to make the Single Tumbling E test with two cards hinged together, so there are only 4 STE targets, one on each side. The chosen sizes were 100M, 125M, 800M and 500M. In millimeters, the height of these four E’s were 15cm, 9.5cm, 6 cm and 3.8 cm.
The recommended testing routine uses only two viewing distances, 100cm, and 25 cm.
At the 1-meter testing distance, the 4 E targets have visual acuity values of (logMAR = 2.00, 1.80, 1.60 and 1.40, or in Snellen format 1.0/100, 1.0/63, 1.0/40. 1.0/25
In “Equivalent Snellen” terms, these are 20/2000, 20/1250, 20/800, 20/500 or 6/600, 6/380, 6/240, 6/150.
At the 25 cm meter testing distance, the 4 E targets have visual acuity values of logMAR = 2.60, 2.40, 2.20, and 2.00, or in Snellen format 0.25/100, 0.25/63, 0.25/40. 0.25/25
In “Equivalent Snellen” terms, these are 20/8000, 20/5000, 20/3200, 20/2000, or 6/2400, 6/1500, 6/950, 6/600.
Thus, the range of STE acuity becomes logMAR = 2.60 to 1.40 (20/8000 to 20/500, or 6/2400 to 6/150). The size increments are in steps 0.20 log units (size ratio=1.60/1). These size increments are not as fine as those used on logMAR letter charts where the steps of size are 0.10 log units (ratio 1.25/1 = 5/4)
Gratings
The grating acuity test also has two hinged cards, so there are four different grating sizes.
It only becomes necessary to use the grating acuity test when the patient cannot achieve an STE acuity of logMAR = 2.60 (20/8000 or 6/2400). The viewing distance for the grating acuity test is 25 cm. The four different stripe widths are 6, 3.8, 2,4, and 1.5 cm. At 25 cm, the logMAR values are 2.90, 2.70, 2.50. and 2.30. (20/16000, 20/10000, 20/6300, 20/4000, and 6/4800, 6/3000, 6/1900, 6/1200)
With the standard BRVT procedure, the limit of the visual acuity range is reached when the patient is unable to identify the orientation of the stripes of the coarsest grating.
Basic Vision Function
The third hinged card pair tests two different aspects of spatial vision. The test panels are presented at a viewing distance of 25cm. One of these two tests we call “White Field Projection.” This test has two panels. One panel is black with a white quadrant; the other panel is half black and half white.
The second test of basic vision function we call “Black-White Discrimination.” One panel is all black; the other is all white.
The standard testing procedure for the BRVT is really quite intuitive if the clinician remains aware that, for very poor vision, the visual task might need to be progressively simplified and that very close viewing distances might be required.
RECOMMENDED STANDARD PROTOCOL
1. The BRVT is used when the top row of the ETDRS logMAR letter chart cannot be read when the chart is at 100 cm.
The patient has failed to achieve a letter chart acuity of logMAR =1.60 (20/800)
2. Begin with the largest (100M) Single Tumbling E presented at 100 cm.
If its orientation can be reliably identified, continue to measure the Single Tumbling E acuity using the four E’s presenting them at 1 meter. But if the patient fails to see the largest E at 100 cm, the viewing distance should be shortened.
The patient has failed to achieve an STE acuity of logMAR =2.00 (20/2000)
3. Now, the STE card pair is presented at 25 cm.
If the patient can tell the orientation of the largest E at 25cm, the Single Tumbling E Acuity can be measured using the 4 different sized E’s. However, if the patient is unable to see the largest E at 25 cm, the visual task needs to be further simplified. The grating acuity test comes next.
The patient has failed to achieve an STE acuity of logMAR =2.60 (20/8000)
4. Now, the Grating card-pair is presented at 25 cm.
If the orientation of the coarsest grating presented at 25 cm can be reliably identified, the grating acuity can be measured using the 4 different grating targets. But if the patient is unable to see the coarsest grating, the limit of the BRVT visual acuity range
has been reached. Next comes the tests of basic vision functions.
The patient has failed to achieve a grating acuity of logMAR =2.90 (20/16000)
5. Now, the Basic Vision Functions card-pair is presented at 25 cm.
The white field projection test begins with the quad-field panel being presented at 25 cm in four different orientations. This is followed by the hemi-field panel and it too is presented at 25cm in 4 different orientations. The patient is said to have a “White Field Projection” if the large white fields can be reliably located. If the WFP test is failed, then the all-black and the all-white panels are presented at 25 cm (subtending 53°) in a random order.
The Visual Acuity Score
The Single Tumbling E and the grating cards have size and visual acuity level information in small print along the edge of the card. The visual acuity values are expressed as logMAR and VAR as well as Snellen equivalents for 20ft and 6 m and as a decimal. The STE cards have these values for both the 100cm and 25 cm viewing distances.
Each Single Tumbling E has four alternative orientations. For an E of a given size at a given distance, a success rate of 4 of 4 indicates that the target is at, or larger than, the patient’s visual acuity limit. For 6 or more presentations, the success rate should be greater than 50% (4 of 6, 5 of 8, etc.)
For the grating acuity test, there are only two alternative orientations. The required success rate is 6 of 6 or, for 8 or more presentations, the success rate should be at least 80% (7 of 8, 8 of 10, etc.).
Clinicians using the BRVT should remain aware that the visual acuity measured with logMAR letter charts, Single Tumbling E’s, or Gratings are presenting different visual tasks. Different visual tasks may give different scores of visual acuity. It is well known that persons with amblyopia or macular degeneration are very likely to have better visual acuity scores when the test targets are isolated and not embedded within a “crowded” display. Many patients who are unable to read across the 5 letters in the top row of a letter chart may be able to identify significantly smaller letters if they are presented in isolation.
THE CLINICIAN’S RESPONSIBILITY
A primary obligation of all ophthalmic clinicians is to preserve the vision of their patients.
This necessarily requires monitoring of the visual abilities of the patients. When vision is very poor and cannot be properly measured with the usual test charts, different tests are required.
“Counting Fingers” and detection of “Hand Motion” are not serious or sensitive measures of visual acuity.
The BRVT provides much better sensitivity for detecting change, and it has a better rationale. It is quick, easy to use, and very well suited to routine clinical practice.
The FrACT computer-based test has more rigidly controlled procedures and can provide excellent sensitivity. I would recommend the FrACT for research purposes and for use in more academic environments.
Why use the BRVT?
Residual function vision should be quantified in order to monitor disease progression and to guide intervention decisions when there are changes in vision.
Prediction of functional abilities and giving appropriate advice to patients are often guided by measures of visual acuity and other visual functions. The patient’s functional visual abilities and limitations, as well as the implications, should be discussed whenever the patient experiences any changes in vision.
Today, there are emerging technologies, electronic and biological, being developed to restore vision in persons who are totally blind or almost blind. Measuring the success of these interventions requires good measurement of visual functions. The tests of visual acuity should have fine increments and be sensitive to differences and changes, even in patients with ultra-low vision.
Sometimes, measurements of visual acuity are required to determine eligibility for services or participation. In most sports for the blind and visually impaired, there are currently three different classes of visual impairment that are based on visual acuity and visual field criteria. The International Paralympics Committee, the Blind Sports Association, and several other sports organizations use the BRVT and some special testing procedures for testing visual acuities and making classification decisions about their visually impaired athletes.
Public health agencies and services need indicators of the functional capabilities of the visually impaired persons they serve. Better visual acuity information can be useful in guiding the planning and implementation of rehabilitation services.
In my opinion, it is professionally negligent for optometrists or ophthalmologists to only use count fingers or hand motion when measuring vision when it is too poor to measure it in the usual way on the traditional chart. Much better tests are readily available and at very little cost, either money or time. The BRVT is one such test.

Assessment and Rehabilitation are critical to those who suffer from Low Vision and can help them learn how to stay independent and make the most of their sight. A diagnosis and eventual rehab can help your patients with low vision live full, active lives.
Browse through our highly standardized vision tests which cover the vast array of Low Vision assessment tools found exclusively at Precision Vision.

Q: With Sloan being such a popular optotype, why did you choose Tumbling E for the BRVT?
A: While Sloan letters are the most favored optotypes for logMAR charts, it would be cumbersome to use isolated Sloan letters. This would require 10 different letters at each size level. For Landolt Rings and Tumbling E’s only one optotype is required at each size level and they can be rotated to give different orientations (usually 4) that the patient is required to identify. The Landolt Rings and the Tumbling E’s are familiar and well-accepted optotypes. We consider that the Tumbling E is the better choice of the two because it is a more complex target.