September 24, 2025
 Articles
 Newsletters
 Videos
Visual acuity refers to the clarity or clearness of the vision, a measure of how well a person sees. The word “acuity” comes from the Latin “acuitas” = sharpness25.
The visual function that is measured most often is visual acuity. Clinical testing of visual acuity is most commonly based on letter recognition. Letter recognition is a rather complex function; it requires not only the optical ability to resolve the image, but also the cognitive ability to recognize it, and the motor ability to respond4.
In 1623 Daza de Valdes described an often-quoted method based on the ability to resolve mustard seeds2. By writing his book in 1623, The Use of Eyeglasses, Daza de Valdés became what some refer to as the father of current-day optometrists. He explains how to measure the strength of the eye in the form of a platonic dialog between two friends – one nearsighted, the other farsighted – and an optical practitioner who advises them what to do to overcome their visual problems. Other chapters deal with the optical explanation of the working mechanism of lenses for visual perception. All his explanations are illustrated by straightforward drawings, making optic theories accessible to seventeenth century readers.
In 1843, Heinrich Kuechler, a German physician in Darmstadt, had argued convincingly for the need for standardization of vision tests and had produced three charts (Figure 1) to avoid memorization and a standardized set of instructions3. Kuechler’s charts were meant for distance measurements and contained only one word on each line. Note the similarity to the set of three ETDRS charts and their instructions today. However, he was a decade too early, the profession was not ready – his work is almost completely forgotten1.
In 1851, Franciscus Cornelis Donders ( from Utrecht, Holland) was a professor of physiology with some interest in vision. He defined a reference standard the performance of an eye to recognize letters that subtend a visual angle of 5 minutes of arc. He then compared the performance of patients’ eyes to that reference standard. He chose a physical reference standard that can be reproduced anywhere. Comparing the letter size recognized by the patient to the reference standard gives us the MAgnification Requirement (MAR) needed to bring that patient to the same performance as a standard eye. The reciprocal of the MAgnification Requirement is the Visual Acuity (Figure 2). MAR can also be interpreted as “Minimum Angle of Resolution” and its logarithm (log MAR) as a measure of detail vision.
Size seen by patient/Size seen by “standard eye” = MAgnification Requirement
Visual Acuity = 1/MAgnification Requirement
| MAgnification Requirement | Visual Acuity | ||
| 2x | 1/2 | 0.5 | 20/40 |
| 4x | 1/4 | 0.25 | 20/80 |
| 10x | 1/10 | 0.1 | 20/200 |
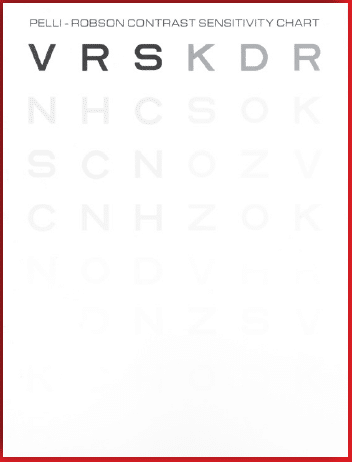
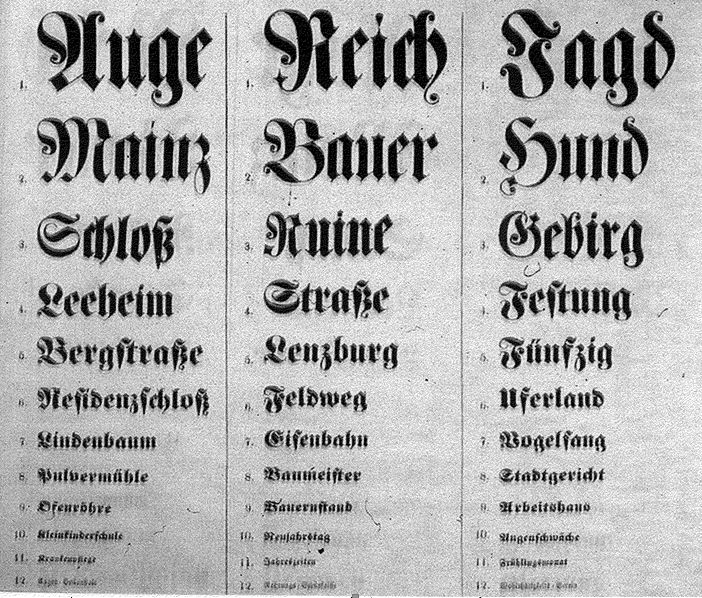
In 1854, Eduard von Jaeger6 in Vienna published a series of reading samples7. Strong points of Jaeger’s reading samples were that they were published in many languages and with excellent print quality using typefaces from the State Printing House in Vienna. The well-known “Jaeger numbers” refer to the item numbers in the Printing House catalogue and have no numerical meaning. Since there was no external standard, future imitations had to rely on approximations with their own locally available type faces. The result is that a random sample of today’s Jaeger cards which show enormous inconsistencies (Figure 3).
All current “Jaeger” samples are larger than the original. Their variation is such that standardization is impossible. Jaeger had no way to compare performance at different distances and never defined a preferred viewing distance. Jaeger’s test measured reading performance as a function of print size, not as a function of the eye1. To read further on the debate about Jaeger notations and numbers, please see this article in our resources.
Hermann Snellen (Dutch ophthalmologist ) and Dr. Fransiscus Cornelis Donders (Eye Infirmary at Utrecht in the Netherland), began instructing patients to stand a certain distance from a lettered chart and recite the characters they could clearly discern. In 1862 Snellen published his letter chart and his most significant decision was not to use existing typefaces, but to design special targets, which he called optotypes. He experimented with various targets designed on a 5×5 grid and eventually, he chose letters (Figure 4).

In 1867-1868 John Green, Sr. proposed a new chart to the American Ophthalmological Society, first in 1867 and with a slight modification in 186813. Figure 5 shows the lower part of Green’s chart of 1868.
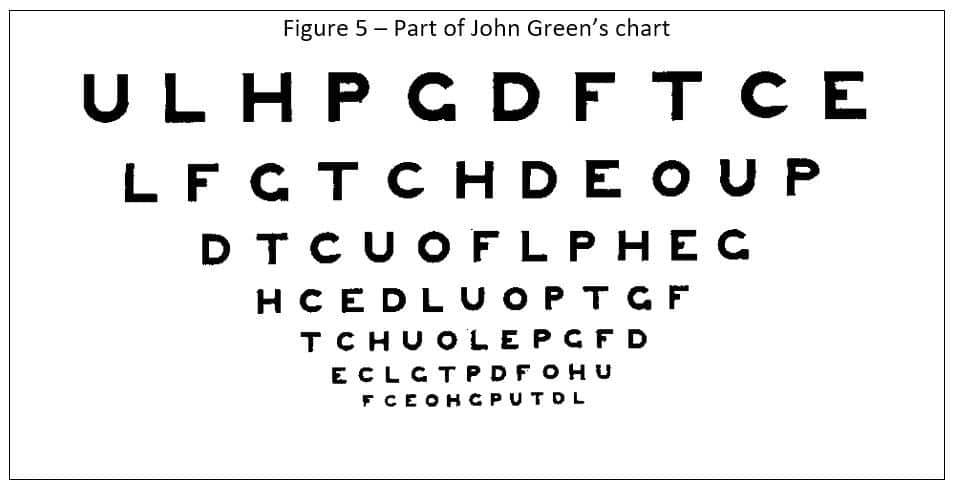
This chart is remarkable for several features. Green used a geometric (logarithmic) progression14. His 1867 chart had six steps from 20/20 and 20/200, as did Snellen’s non-logarithmic chart. The 1868 chart used 10 steps to fit better with the decimal system. Green’s letter and line spacing was not dictated by the available space (as on Snellen’s chart), but proportional to the letter size (equal to the letter width). Lastly, he used letters without serifs (sans-serif), where Snellen had used letters with serifs. His contemporaries rejected that type style because “it looked unfinished”. Ironically enough, a century later, the British standard15 would reject letters with serifs because “they look old fashioned”.
In 1875, Felix Monoyer (of Lyon, France) introduced the decimal notation11, which is used in much of Europe today. Monoyer was also known for introducing the diopter12 as a simplified expression for lens power, replacing the earlier notation of 1/ focal length.
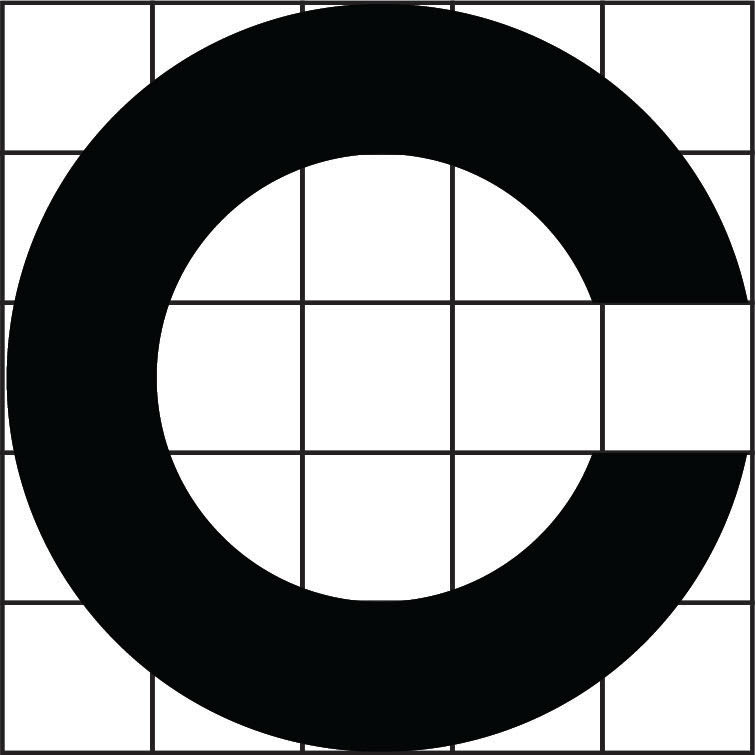
In 1874-1888 Snellen and Landolt had cooperated in publishing a major chapter on “Optometrology”16, the science of measuring vision. They recognized that not all of Snellen’s optotypes were equally recognizable. This led Edmund Landolt (in Paris) to propose the broken ring symbol (1888),10 a symbol that has only one element of detail and varies only in its orientation17. Landolt’s C’s are widely used in laboratory studies and have been accepted as the standard against which other optotypes should be calibrated18.
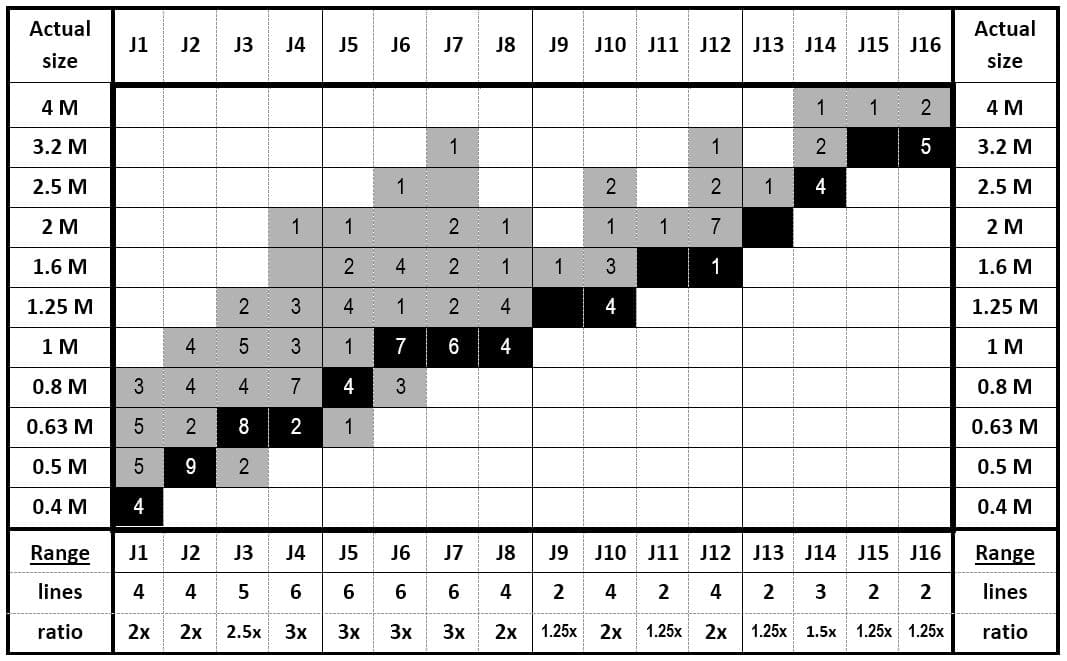
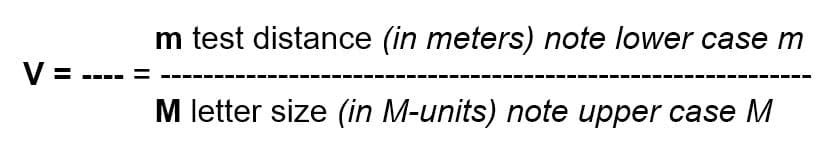
In 1959, Louise Sloan (of the Wilmer Institute in Baltimore) designed a new set of non-serif letters. She also introduced the term “M-unit”. One M-unit subtends 5* of arc at 1 m1. The M Letter designation always represents 5* of arc at the letter sizer in meters. 8.5M = 5* arc (20/20) at 8.5 meters.

Sloan simplified Donders’ definition and made use of the metric system implicit by introducing the term “M-unit” for the “distance in meters at which a standard eye recognizes the optotype” (i.e. at which the optotype subtends 5 minutes of arc). The formula then becomes:
In 1976, Bailey and Lovie (then in Melbourne) proposed a new layout with proportional spacing and five letters on each line21. This required a chart in the form of an inverted triangle, rather than the familiar rectangular format, still used by Sloan. Bailey and Lovie used the same logarithmic progression that had been used by Green, Sloan and by many others. Bailey and Lovie introduced the term log MAR to more easily describe the steps of this progression1.
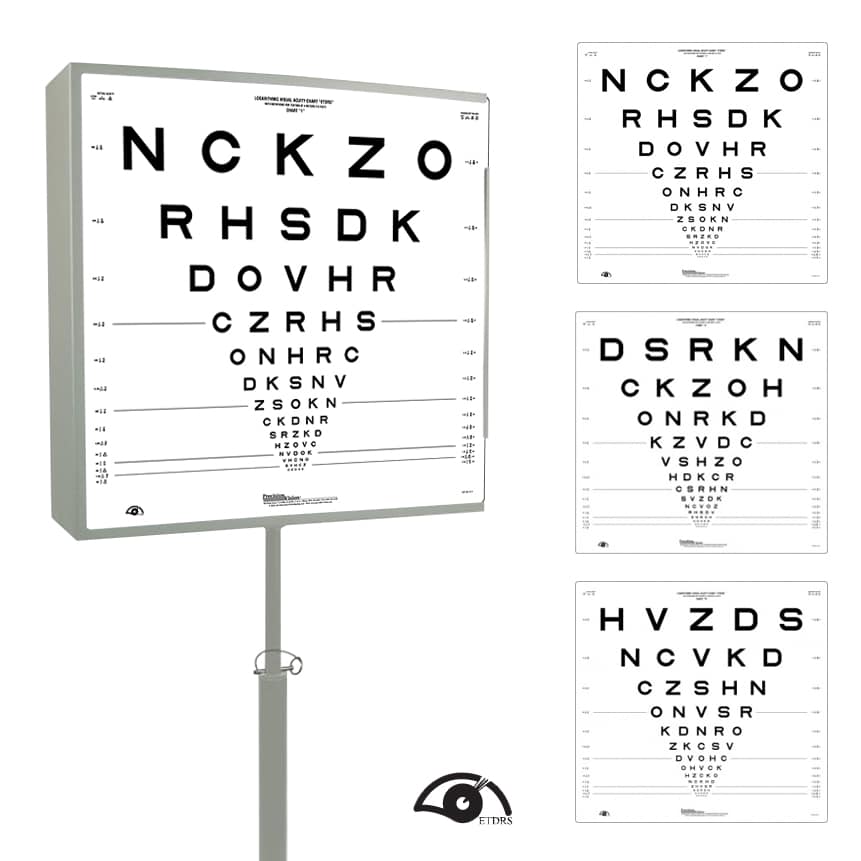
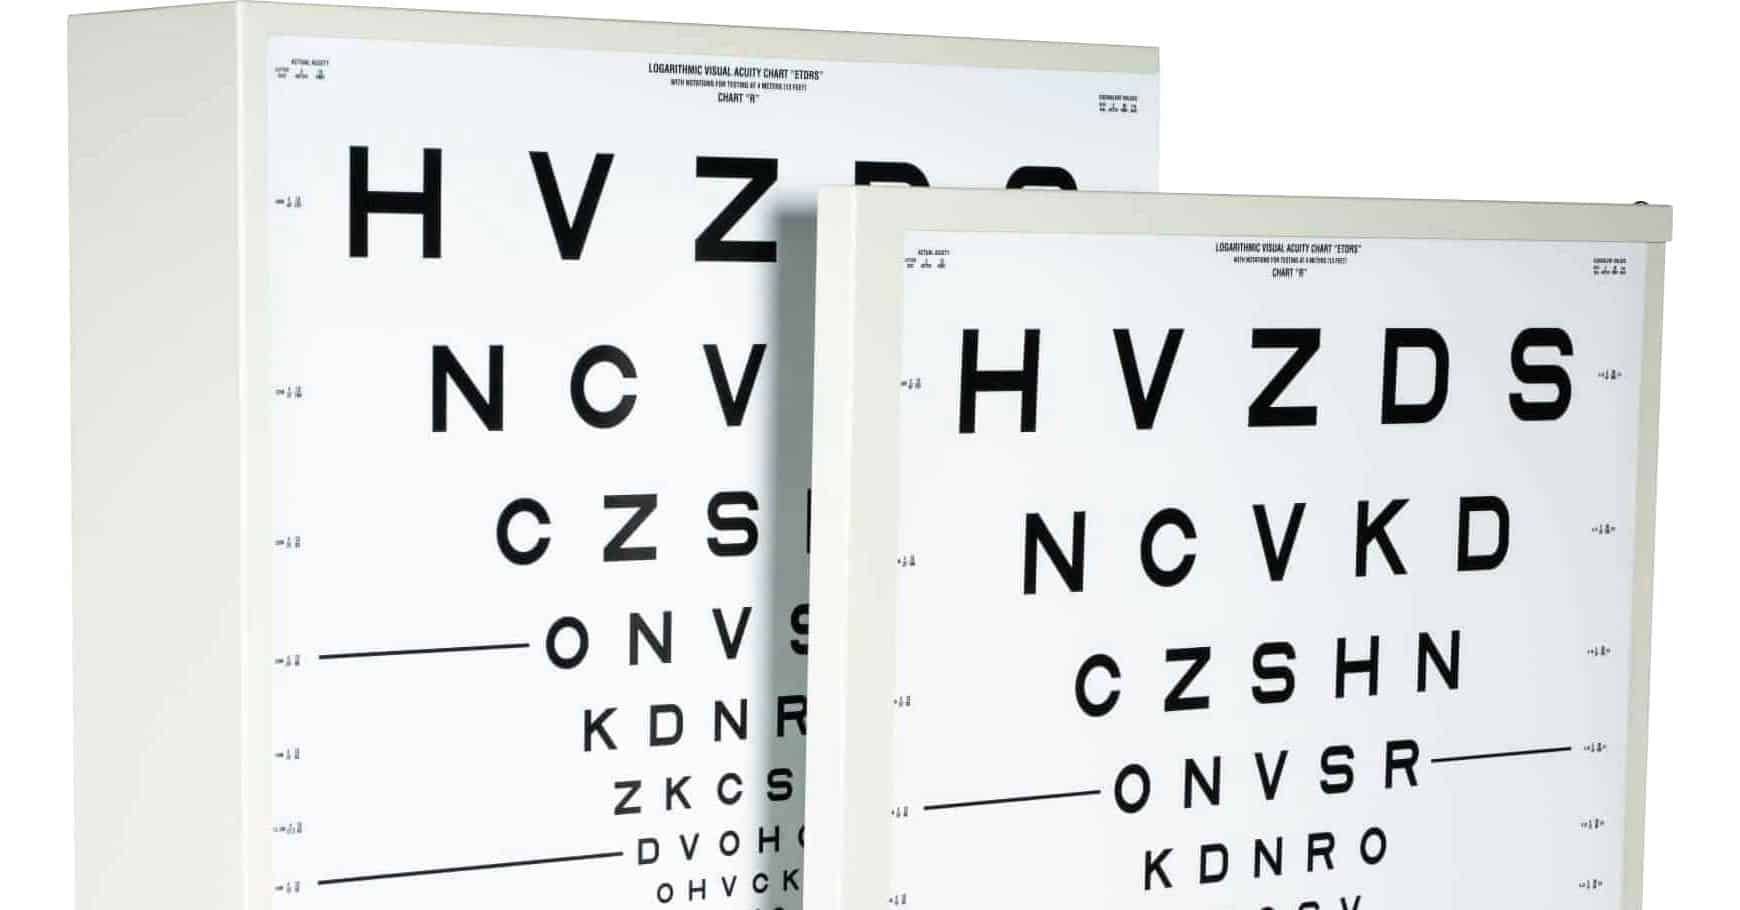
In 1982, the National Eye Institute (NEI) combined the Sloan letter set with the Bailey-Lovie layout to produce charts for use in the Early Treatment of Diabetic Retinopathy Study (ETDRS)23. These charts became known as ETDRS charts. NEI required them for all later clinical studies which did much to popularize the new format and the logarithmic progression. Today, the ETDRS format is the de-facto gold international standard17.
20/20 vision is a term used to express normal visual acuity (the clarity or sharpness of vision) measured at a distance of 20 feet. If you have 20/20 vision, you can see clearly at 20 feet what should normally be seen at that distance. If you have 20/100 vision, it means that you must be as close as 20 feet to see what a person with normal vision can see at 100 feet24. Because visual acuity is so easily measured, it is often used as a primary eligibility criterion. The visual acuity scale is not truncated at 20/20. 20/20 is a reference standard; it is not perfect vision. Snellen chose this standard so that all healthy young adults exceed it. This range allows reading of newsprint (1 M) at 80 to 160 cm. Since normal reading is at about 40 cm, there is a very comfortable reserve.
“Normal” visual acuity for healthy eyes is one or two lines better than 20/20. In population samples the average acuity does not drop to the 20/20 level until age 60 or 70. As previously discussed, the 20/20 reference standard does not refer to the average acuity of American eyes, just as the US standard foot is defined independently of the “normal” length of American feet25. The significance of the 20/20 (1.0) standard can best be thought of as the “lower limit of normal” or as a screening cut-off. When used as a screening test, we are satisfied when subjects reach this level and feel no need for further investigation, even though the average visual acuity of healthy eyes is 20/16 (1.25) or 20/12
(1.6)4.
Since visual acuity is defined by the angle under which letters are viewed, its measurement can be done at any distance, provided that the scale is adjusted for the distance used. When a letter chart is used as a target for subjective refraction, the viewing distance is important, because the longer the viewing distance, the more accommodation will be relaxed.
Snellen’s original charts were calibrated for a viewing distance of 20 Parisian feet. As soon as the Treaty of the Meter was signed (1875) he converted to metric distances and made charts for 5 meter (more convenient with the decimal system) and 6 meter (closer to 20 feet). These distances have the advantage that they relax accommodation and that small forward movements of the patient have a negligible influence.
The NEI ETDRS protocol reduced the viewing distance to 4 meters to have a more manageable chart size.
For testing of children a 3 meter distance (10 ft) is often used, since it is easier to keep their attention at that distance. For smaller areas or shorter examination lanes, charts for 2.5 meter and 2 meter are available. For testing of Low Vision patients a 1 meter distance is advantageous, since it can cover a much wider range of visual acuity values. A typical 1-meter chart covers visual acuities from 20/1000 to 20/20. It requires 1 D over the distance correction.
For testing of reading acuity, various distances have been used. The distance of 40 cm is a commonly recommended as standard near vision.
Most charts for use at 1 meter or less have a cord attached to facilitate maintaining the accurate viewing distance.
Snellen’s innovation was to design specific characters to be used only for the measurement of visual acuity. He called these characters optotypes and designed them all on a 5×5 grid. Although Snellen also experimented with other symbols, he chose letters for his chart since they have most face validity for literate patients. There is also a need for optotype recognition and naming in the case of young children and illiterate adults, other symbols have been created and should be used.
Letters are the obvious first choice for adults. Many different letter sets have been used. Since the establishment of the ETDRS protocol, Sloan letters have become the preferred choice. They are designed on the same 5×5 grid on which Snellen designed his letters.
EuroWide optotypes are modified ETDRS charts that contain only capital letters that are common to all three European alphabets (Latin, Greek, Cyrillic), and are thus recognizable for a much wider population. The new charts have been validated against the original ETDRS charts in Greece, Bulgaria and Belgium. They were found to produce comparable visual acuity scores with a test-retest repeatability of about 0.10 logMAR.
Numbers are the second choice for adults. Even illiterate adults can often recognize numbers. Deaf/non-verbal adults can indicate the number seen with simple finger signs. PV Numbers are designed on a Snellen’s 5×5 grid and have been calibrated against Sloan letters.
Tumbling Es can be used for young children. They are the optotype of choice for many studies in the developing world.
Landolt Cs are often used in research studies, but have found limited application in clinical practice in the US. Tumbling Es and Landolt Cs offer four and eight alternative directions; a prerequisite is that the subject can duplicate this direction, which may be a problem for children with a young developmental age.
HOTV charts also offer only four choices. The four letters H, O, T and V have been chosen because they are R/L symmetrical. The letters A and X are also used on occasion.
Numerous picture cards have been designed. A problem is that not all children are equally familiar with all pictures and that many picture sets have uneven difficulty. Most pictures cannot be designed on a 5×5 grid.
Patti Pics are stylized symbols designed on the basis of the 5×5 Snellen grid and calibrated for equal recognition against Sloan letters. Visual acuity readings should not change appreciably when children are advanced from Patti Pics to a regular letter chart.
Charts are available in a variety of testing distances as well as all of the above optotypes: Sloan letters, European-Wide, PVNumbers, Tumbling E’s, Landolt C’s, HOTV and Patti Pics.
In summary we have discussed visual acuity as measured with letters or symbols. We have seen that Visual acuity is defined as the reciprocal of the MAgnification Requirement (MAR) of a subject compared to a reference standard. Snellen chose the 20/20 reference standard to represent easily recognized letters; 20/20 is less than average and less than perfect vision. Although visual acuity is the most often measured parameter of vision, it considers only one aspect of vision (the MAgnifi cation Requirement). Other aspects, such as visual field and contrast sensitivity are equally important in defining the functional capabilities of the subject.
To read further details regarding visual acuity, letter chart measurements, converting notations, near vision & reading, contrast sensitivity, low vision and pediatric tests, please click here to read Dr. August Colenbrander’s Introduction to Visual Acuity Measurement.