


Snellen Eye Chart - a Description and Explanation
Snellen Eye Chart Snapshot
The Evolution of Visual Acuity Measurement from Snellen to ETDRS
Snellen Eye Chart Snapshot What Dr. Herman Snellen did for the field of vision testing is comparable to what the first automobile engineers did to revolutionize the car industry. These pioneers saw a need for change and additional resources at a time when people were yearning for better quality and higher standards of living in their day-to-day experiences.
The Snellen eye chart got its start in 1862 during the Second Industrial Revolution, nearly 150 years ago. At that time, ophthalmology was at the brink of a period that would later be called “The Golden Age of Ophthalmology”, during which ophthalmology would become the first organ-based specialty.
Dr. Snellen, a Dutch ophthalmologist, developed the Snellen chart to measure a person’s visual performance against an objectively defined and repeatable reference standard. At this point, there were only reading tests that relied on whatever fonts were available at the local print shop, but no objective standards. To provide a standard, Dr. Snellen designed stylized letters on a 5×5 grid, which he called “optotypes.” He defined the reference standard (known today as “20/20”) as the ability to recognize one of his optotypes when it subtends an angle of 5 minutes of arc. He described this as a size that can be “easily recognized by normal observers.”
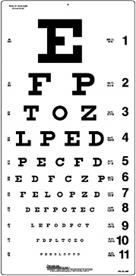
Original Snellen Charts
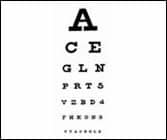
The original Snellen chart had a rectangular shape with seven rows of letters printed progressively smaller as you move down the chart. Many variations of the Snellen chart exist today. Their commonalities include the rectangular shape, which dictates that varying numbers of optotypes occur on each line as the space allows. Different charts may have a different number of lines and may vary in the size progression. Shown are Snellen’s original chart and a common U.S. variant on which large numbers on the side make it easy for malingerers to decide to which line they will choose to read. These Snellen charts feature optotypes with serifs.

Evolution of Visual Acuity Charts
On most Snellen charts the progression of letter sizes is irregular and may vary from 14 percent (20/70 to 20/80) to 100 percent (20/100 to 20/200 to 20/400). It took over a century of collaborative milestones to transform this legacy format into modern diagnostic instrumentation:
1862 – Dr. Herman Snellen
Developed the first standardized visual acuity chart using stylized letters designed on a 5×5 grid matrix, setting a repeatable baseline reference standard.
1868 – Dr. John Green
Proposed replacing non-uniform steps with a consistent geometric (logarithmic) size progression of 25 percent per line, alongside non-serif typefaces and proportional geometric spacing.
1959 – Dr. Louise Sloan
Redesigned the optotype characters using non-serif letter profiles and introduced the simplified metric "M unit" notation system.
1976 – Bailey & Lovie
Proposed an inverted triangular chart layout featuring a uniform set of five proportionally spaced letters on every single row.
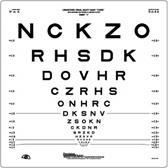
1982 – The ETDRS Standard
The National Eye Institute combined Green's logarithmic progression, Sloan’s optimized letters, and the definitive Bailey-Lovie triangular structure to create what is universally mandated today as the gold standard for clinical research trials.
Understanding M Units
Sloan coined the term M unit to designate the size of optotypes, representing the denominator of a metric Snellen fraction. This notation simplifies Snellen’s verbose definition; instead of stating that a letter “subtends 5 minutes of arc at ‘x’ meters”, one can simply say that the letter is ‘x’ M units.
Thus, a letter size of 1M represents 20/20 when shown at 1 meter, a 2M letter represents 20/20 at 2 meters, and a 2.5M letter represents 20/20 at 2.5 meters. Most of the eye charts Precision Vision manufactures have M units printed on them.
The ETDRS Gold Standard
In 1982, when the National Eye Institute needed standardized charts for its “Early Treatment of Diabetic Retinopathy Study” (ETDRS), it established this coordinated format. This chart style has been officially accepted by the National Eye Institute and the FDA, mandating its integration across multi-center clinical trials performed worldwide. It is accepted across the globe as today’s Gold Standard for accurate visual acuity measurement.
The term Snellen chart is universally accepted, but not universally understood. Many variants of the original Snellen vision chart remain in active clinical use today, but Precision Vision manufactures the ultimate evolutionary refinement: the official “ETDRS” layout. For deep-dive explanations on modern variants, please click here.

Traditional vs. Modern Snellen Charts
The traditional Snellen eye chart is still widely used and, in many cases, can be acceptable. However, any practitioner would serve the process better by using an updated, modernized Snellen chart layout. Precision Vision manufactures custom testing solutions tailored to many different test distances and several different optotypes, each one serving a specific task.
With the additional enhancements made by Dr. Green and Dr. Louise Sloan, present-day Snellen charts follow a logarithmic progression, have improved letter design, and have a uniform 25 percent increase from line to line.
Unlike a traditional rectangular Snellen chart, ETDRS layouts enforce an absolute equality across lines, using the exact same number of optotypes on each line. This careful geometric balance completely prevents mistaken gain and loss of lines while tracking patients over extended lengths of time. Today’s improved Snellen eye charts follow most of these rules with the exception of sometimes using less than five letters on a line. For further study on diagnostic compliance tracking, read about Measuring Snellen Visual Acuity.
Related Terms
Snellen chart • Snellen eye chart • Snellen • Snellen eye test • Snellen visual acuity • Snellen acuity • Snellen vision chart • Snellen test