


EyeOnVision - Blind Cricket (BRVT)
The Berkeley Rudimentary Vision Test (BRVT)
Development, Architectural Foundations, and Clinical Applications in Ultra-Low Vision Assessment

The 25 cm square calibrated diagnostic panel configuration
It All Started Over a Game of Blind Cricket
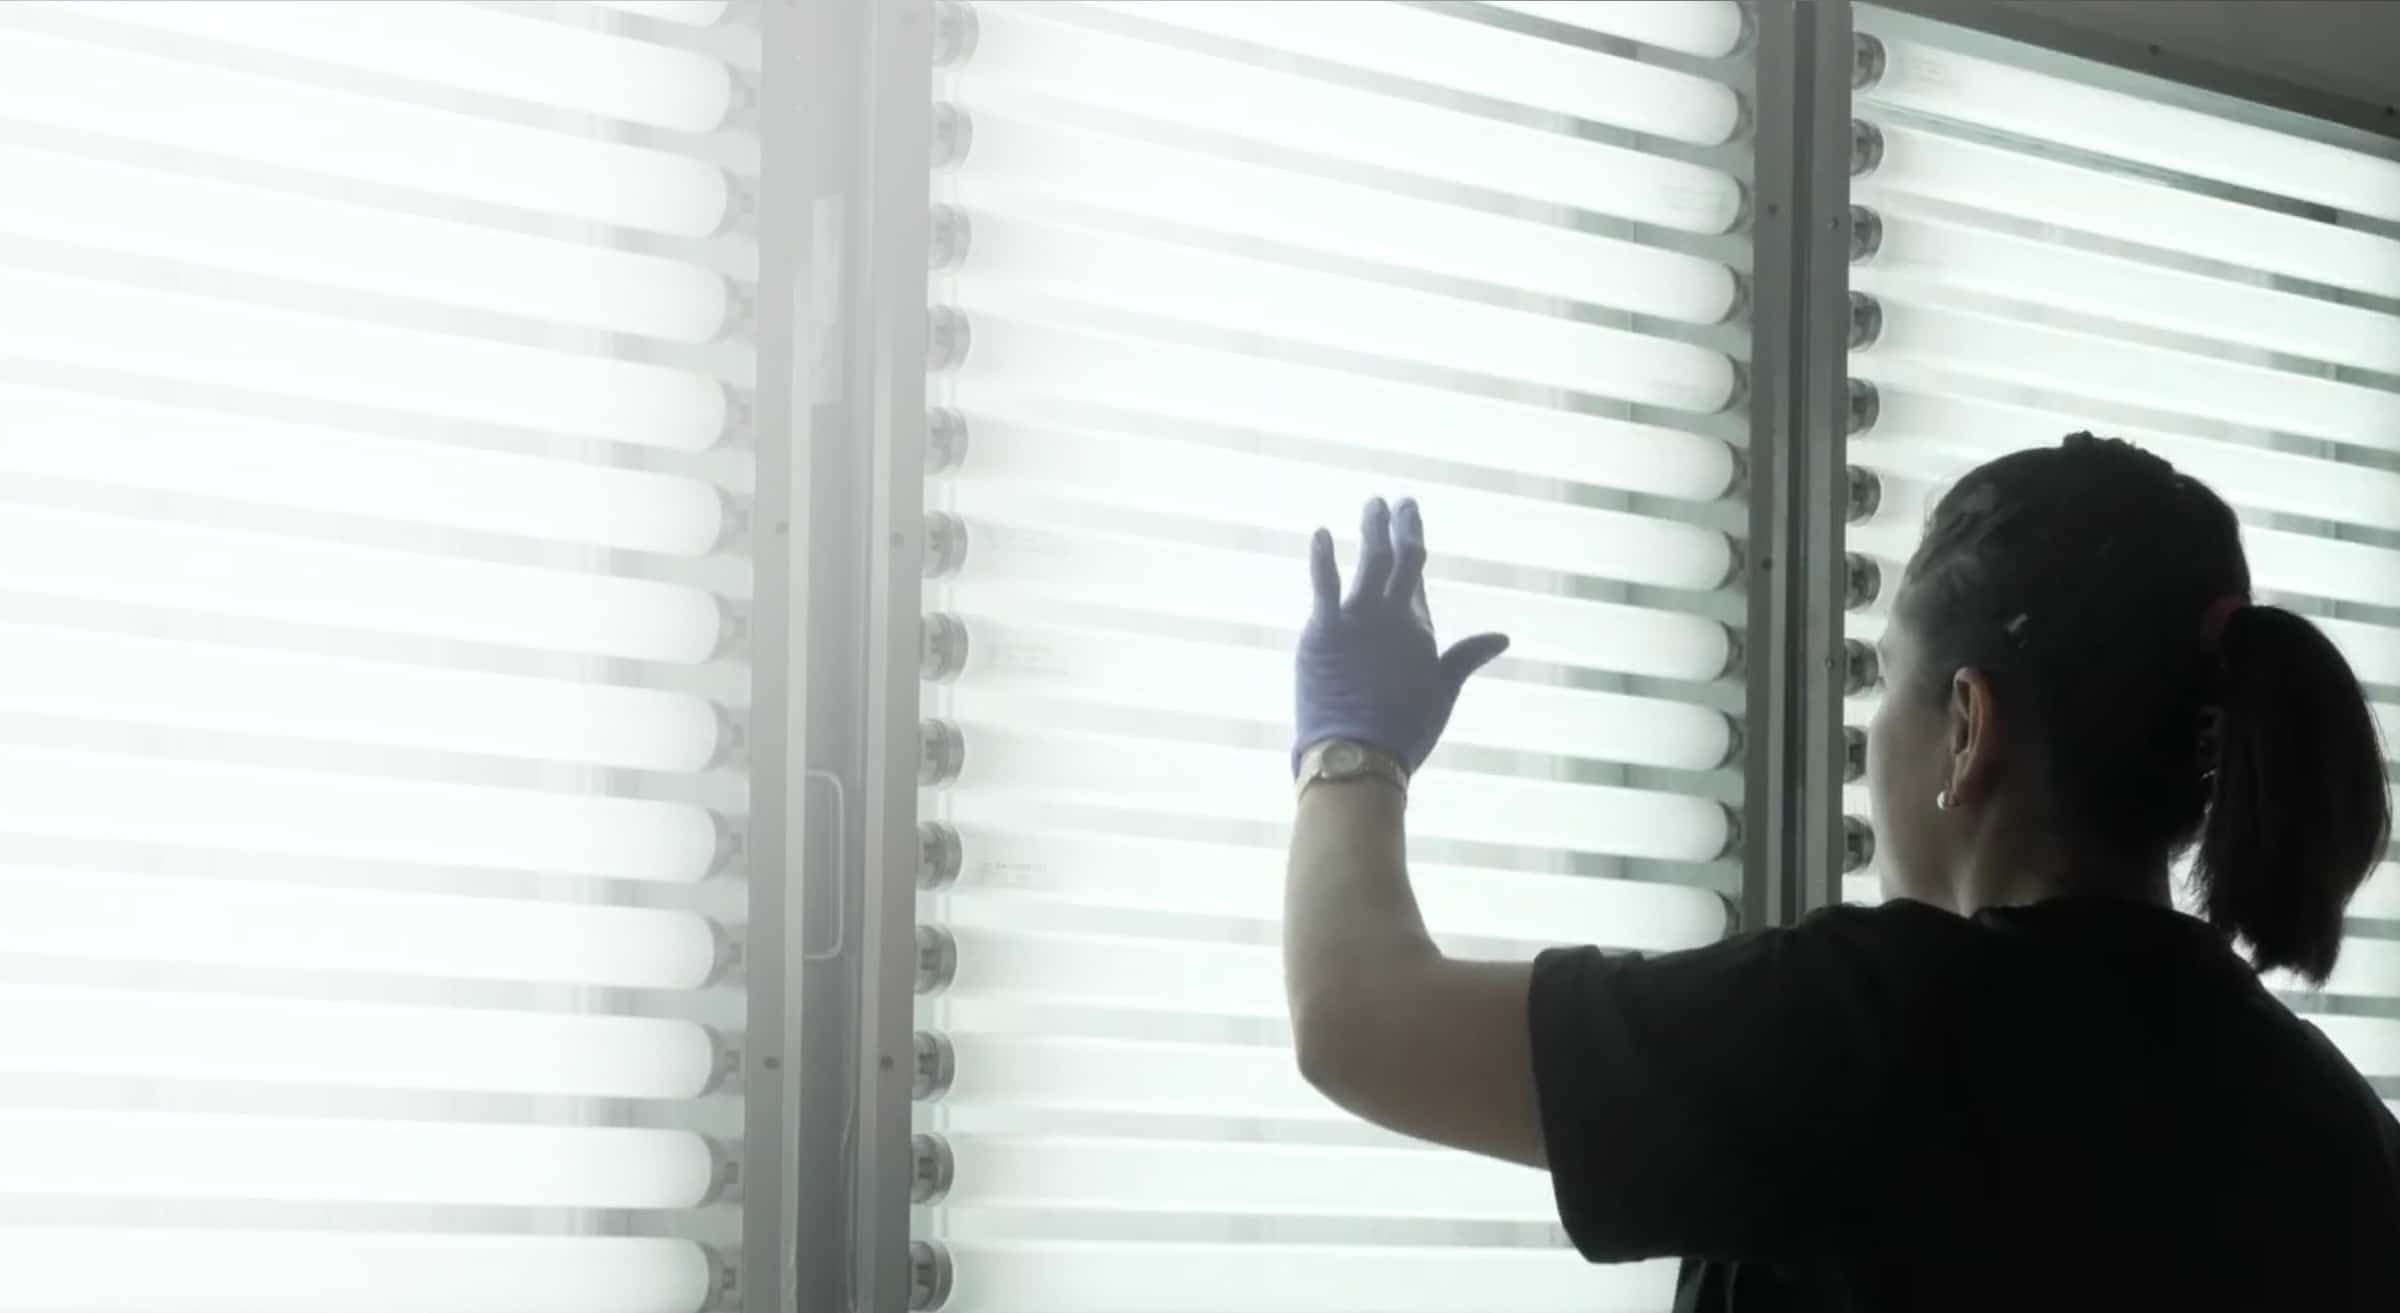
The greatest development in the field of low vision assessment in decades was a direct result of observing an international competition for blind cricketers. In October 2007, I was invited to Brighton, England, to join an Advisory Committee on Vision Standards for the World Blind Cricket Council (WBCC). Visual acuity served as the primary classification criteria to balance team compositions across three distinct impairment tiers. However, one of the rules relied on the highly unscientific metric of being “unable to recognize a human hand at any distance.” It was immediately obvious that a profound change was required.

I began my career as a low-vision clinician in 1972, rejecting the primitive clinical practice of counting fingers (CF) and using hand motion (HM) when vision is too poor for standard charts. These traditional methods are neither well-defined nor well-controlled. My early preference was to bring a Bailey-Lovie or Feinbloom chart very close to the patient, calculating a score from the viewing distance and letter size. It wasn't until late 2007 that I directed serious attention toward engineering an alternative for the extreme poor end of the visual resolution scale.
The structural catalyst occurred two weeks after the WBCC meeting, during an invitational seminar organized by Art Jampolsky at the Smith-Kettlewell Eye Research Institute (SKERI) in San Francisco, titled “Visual Prostheses: Toward Standards for Outcomes and Their Evaluation.” Researchers evaluating early visual electronic retinal implants were still defaulting to primitive CF and HM scripts. Michael Bach had developed the computer-based Freiburg Acuity and Contrast Test (FrACT), which provided excellent psychophysical thresholding algorithms.
However, drawing from my experiences testing children at Schools for the Blind in Malawi, I recognized a critical need for an acuity tool that was simple, entirely portable, free of electrical power or batteries, and operable in any environmental condition. I initially built a PowerPoint script using Single Tumbling E’s (STEs), square wave gratings, and quadrant localization targets. While functional in the UC Berkeley clinic, it was slow and clumsy. This led to a year-long collaboration on sabbatical with Jonathan Jackson from Belfast—cutting, pasting, and testing cardboard prototypes alongside Robert Greer and Marlena Chu in Berkeley, while consulting regularly with Hasan Minto in Pakistan.
The Three Core Fundamental Principles of the BRVT
Our group reached an structural agreement on three basic rules to govern the architecture of the new diagnostic test:
- Letter Chart Limitations: There is a definitive physical and cognitive limitation to the range of visual acuity that can be measured with an interconnected letter chart array.
- Task Simplification Framework: Beyond the physical boundary of the letter chart, the visual task must be simplified systematically. Reading isolated single optotypes is simpler than parsing chart rows. Identifying the orientation of square-wave gratings is simpler than recognizing single optotype shapes.
- Ultra-Close Viewing Geometries: Very close viewing distances are mandatory when it becomes necessary to present target fields at extremely large angular sizes.
Limitations of the Acuity Range with Letter Charts
The logMAR chart design by Bailey and Lovie (1976) standardized visual acuity testing using 5 letters per row, a logarithmic size progression, and proportional spacing. The universal gold-standard ETDRS chart (1982) adapted these principles to a 4-meter testing distance with Sloan optotypes. At 4 meters, the top row represents a logMAR value of 1.0 (20/200), subtending a visual angle of about 7.5°.
When a patient cannot read this row, the common practice is to move the chart closer. However, 1 meter is the absolute closest distance an ETDRS chart should be presented. At 1 meter, the top row subtends an angle of approximately 30° (±15°). Any wider, and the patient must employ compensatory head turns or body twists to read from edge to edge. Furthermore, at 1 meter, there is a 3.5% distance variation between the eye to the center versus the outer margin of the chart, introducing edge distortion.
At 1 meter, the top 40M row represents a logMAR value of 1.60 (20/800). Because the top row lacks an upper bounding row, its letters are less embedded or cluttered, presenting a slightly altered visual task. Therefore, the absolute physical limit of chart-based testing is reached when a patient fails to read the second row from the top at 1 meter—meaning their acuity is poorer than logMAR 1.60 (20/800). When a patient falls below this threshold, the task structure must be simplified.
Systematic Deconstruction & Task Simplification
Visual Acuity with Isolated Single Optotypes
Using isolated single optotypes simplifies cognitive demands compared to a full crowded chart. Sloan letters are impractical here because they require 10 distinct shapes at every size level. Landolt Rings and Tumbling E’s require only one target rotated across 4 orientations. We chose the **Tumbling E** because it is a more complex, representative target.
With a Landolt Ring near threshold, the observer often infers the gap location by perceiving a small asymmetrical spot or blob rather than resolving the gap itself. The Tumbling E—constructed with three parallel limbs and a connecting crosspiece—creates an asymmetrical blur block at threshold. The observer’s task is to identify patterns, irregularities, or features within that blur block to determine orientation. This task closely mirrors the complex spatial resolution required to differentiate similar letters (like H versus N) near threshold. The largest target is a 100M letter E (14.5 cm high), which subtends a 30° angle when viewed at 25 cm, yielding a logMAR boundary value of 2.60 (20/8000).
Visual Acuity with Square-Wave Gratings
When a patient cannot resolve the isolated 100M Single Tumbling E at 25 cm, the task must be simplified further using **square-wave gratings**. Resolving grating orientation does not require a patient to restrict attention to a local area or analytically construct a shape. Fixation control becomes irrelevant. The observer simply notes whether horizontal or vertical stripes are present anywhere within the field, including peripheral vision.
This explains why patients with profound central scotomas (vision loss spots) struggle with optotypes but easily identify grating orientations. The coarsest grating in the BRVT consists of two black and two white stripes, each 6 cm wide, creating a black-white cycle of 28° at a 25 cm distance. This equates to a logMAR value of 2.90 (20/16000). If this test is failed, acuity testing terminates, and basic spatial function tests begin:
• **White Field Projection (WFP):** Evaluates quadrant or hemi-field localization across a large 52° square field split into black and white sections.
• **Black-White Discrimination (BWD):** Measures absolute fields using solid black and solid white 25 cm cards to test light differentiation at a 53° angular field of view.
Practical Dimensional Considerations
To manage a balance between broad range coverage, practical card volume, and manageable sizing steps, we standardized all cards to **25 cm (10 inches) square**. This uniform dimension makes the kit highly portable and allows the physical card edges to serve as a precise measuring tool to verify the 25 cm testing distance.
| Card Pair Target Set | Physical Stripe / Letter Dimensions | Testing Distance Geometry | LogMAR & Snellen Equivalent |
|---|---|---|---|
| Single Tumbling E (STE) Hinged Pair (4 Targets) |
100M, 125M, 80M, 50M Heights: 15, 9.5, 6, 3.8 cm |
100 cm (1 Meter) |
logMAR 2.00 to 1.40 20/2000 to 20/500 6/600 to 6/150 |
| Single Tumbling E (STE) Same Card Array |
100M, 125M, 80M, 50M Heights: 15, 9.5, 6, 3.8 cm |
25 cm |
logMAR 2.60 to 2.00 20/8000 to 20/2000 6/2400 to 6/600 |
| Square-Wave Gratings Hinged Pair (4 Targets) |
200M, 125M, 80M, 50M Stripe Widths: 6, 3.8, 2.4, 1.5 cm |
25 cm |
logMAR 2.90 to 2.30 20/16000 to 20/4000 6/4800 to 6/1200 |
| Basic Vision Function Spatial Projection / Discrimination |
White Field Projection (Quad / Hemi) Black-White Discrimination Panels |
25 cm | Categorical Assessment Subtends 52° & 53° Visual Fields |
Recommended Standard Protocol Execution
The standard testing sequence for the BRVT is highly intuitive if the clinician remembers that, for patients with ultra-low vision, tasks must be simplified progressively and viewing distances must be systematically shortened:
Failure implies acuity is poorer than logMAR 2.00 (20/2000).
Failure implies acuity is poorer than logMAR 2.60 (20/8000).
Failure implies acuity is poorer than logMAR 2.90 (20/16000).
Determining the Visual Acuity Score
Each Single Tumbling E and Grating card features calibration metrics printed in fine text along its margin, expressing values in logMAR, Visual Acuity Rating (VAR), decimal, and Snellen equivalents for both 20 feet and 6 meters.
Because each Single Tumbling E presents 4 alternative choices, a success rate of **4 of 4** demonstrates definitive resolution at or above that tier. For extended testing over 6 or more variations, a success rate **greater than 50%** (such as 4 of 6 or 5 of 8) is required to score. For the two-choice Grating Acuity test, the forced-choice threshold requires a success rate of **6 of 6**, or at least **80%** over extended presentations (e.g., 7 of 8 or 8 of 10).
The Clinician's Professional Responsibility
A primary obligation of all ophthalmic clinicians is to preserve and monitor the vision of their patients. When sight is too poor to be measured with standard wall charts, counting fingers and hand motion are simply not serious or sensitive diagnostic practices.
Quantifying residual function is critical to track underlying disease progression, modify medical or surgical interventions, and provide realistic advice to guide rehabilitation. As emerging electronic micro-arrays and biological gene therapies expand to restore sight to the profoundly blind, sensitive measurements with fine increments are mandatory to capture clinical success.
This rigorous metric definition is why international bodies—including the International Paralympic Committee (IPC) and the Blind Sports Association—mandate the BRVT for classification decisions to maintain competitive sports equity. In my opinion, it is professionally negligent to rely on finger counting or hand waving when accurate, inexpensive, and efficient tests like the BRVT are readily available to serve the visually impaired population with integrity.
Download the Complete Technical Document Natively
Access the complete, printable research brief outlining psychophysical thresholding values, visual angle derivations, and authorized global clinic distribution tracks.
Get Printable PDF Version

%0A%20%20%20%20%20%20%20%20%0A%20%20%20%20%20%20%20%20%0A%20%20%20%20%20%20%20%20%20%20%20%20Development,%20Architectural%20Foundations,%20and%20...)