


June 2015
Shedding Light on the LuxIQ™ System
An Inside Look at Jasper Ridge’s Scientific Approach to Task Lighting and Filter Prescriptions
In continuation of our “Behind the Test” series, this month we dive into a revolutionary examination tool designed to standardize task lighting and absorption filter prescriptions. The LuxIQ™ from Jasper Ridge is a first-of-its-kind low vision system capable of quantifying visual performance across a broad spectrum of illuminance levels, color temperatures, and optical filters.
Precision Vision sat down with Jasper Ridge’s President, Michele Klein, to discuss the development of this clinical asset and how it can elevate daily practice parameters while directly improving patient outcomes.
PV: Michele, thanks for joining us. Can you provide some foundational background on the development of the LuxIQ™ diagnostic system?
Michele Klein: Patients experiencing profound vision loss—and their families—frequently feel isolated or desperate for concrete answers. Dedicated clinicians deeply regret having to tell a patient, “there is nothing more we can medically do for you.” Now, there is an immediate, actionable next step: optimizing localized task lighting. The LuxIQ™ makes it practical to accurately measure and prescribe customized light settings. Before its launch, there was no standard, repeatable, or practical quantitative method to recommend lighting for near-acuity tasks. The LuxIQ™ finally gives practitioners a science-based methodology for the office or home environment.
PV: Why has it historically been so difficult to accurately measure lighting properties to improve functional vision?
Michele Klein: Traditional trial-and-error methods—such as manually swapping out physical lightbulbs, adjusting desk lamps, or cycling uncalibrated filter sheets—are slow, highly subjective, and carry minimal validation in peer-reviewed clinical studies. Conversely, prescribing with the LuxIQ™ is rapid, strictly calibrated, and backed by multiple independent clinical research validation tracks. It allows eye care professionals to accurately measure and map a patient's optimized lighting baseline in less than 5 minutes.
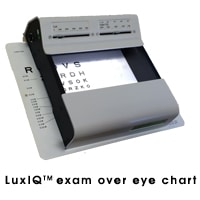
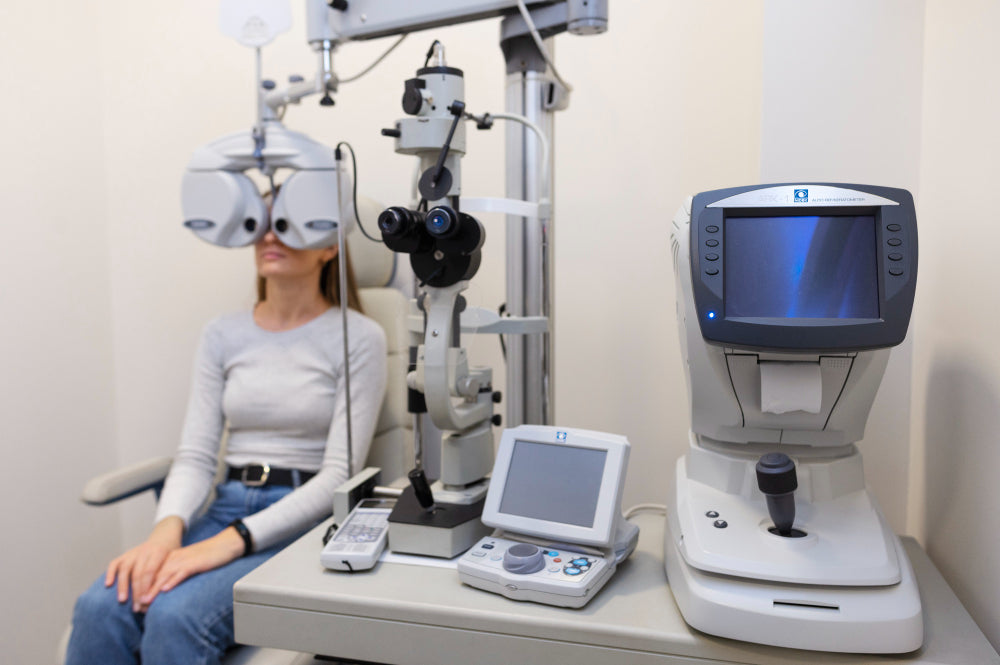
The portable LuxIQ™ calibrated light evaluation system
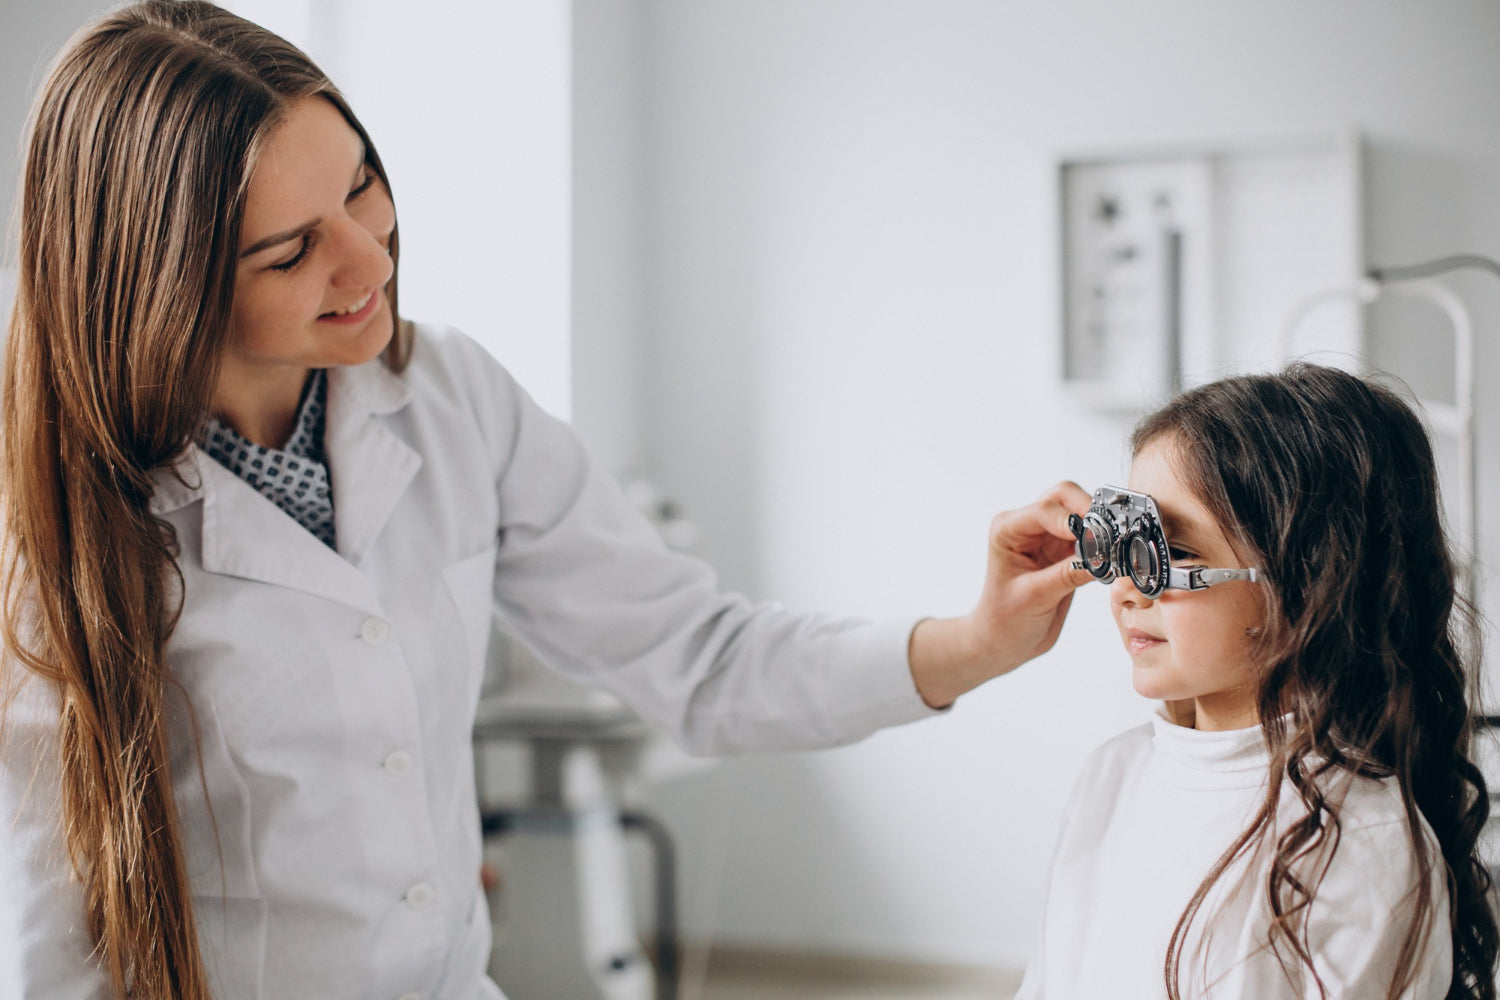
LuxIQ wearable integration simulating task-oriented reading configurations
Quantifying Visual Performance via Calibrated Illuminance
PV: Can you explain how the LuxIQ™ improves the process of quantifying visual performance through targeted task lighting prescriptions?
Michele Klein: Published literature shows that many low vision patients require intensive, focused light levels ranging between 2,000 and 5,000 lux to maximize their resolution threshold. For context, a typical office desk lamp outputs roughly 800 lux, while a standard clinical examination room averages only 600 lux. Most individuals navigating central vision scotomas require heavily augmented illuminance vectors to resolve text lines.
The LuxIQ™ provides clinicians with the capacity to fluidly sweep intensity metrics from 0 to 5,000 lux and adapt color temperatures continuously from 2,700K to 6,500°K. This precise control allows users to:
- Isolate precise task lighting coordinates without time-consuming clinical trial and error.
- Prescribe optimized, commercially available lamps and consumer lightbulbs based on explicit science.
- Educate patients and caretakers on fundamental physics principles like inverse-square light dissipation laws.
- Map spectral color-temperature properties to isolate contrast enhancement markers.
- Execute reproducible clinical trial research protocols using rock-solid illuminance controls.
- Track longitudinal lighting requirement deltas over time to accurately chart underlying disease progression.
PV: What are the primary advantages when extending this framework to filter prescriptions and specific age demographics?
Michele Klein: Absorption filters are commonly prescribed to mitigate photophobia or augment edge contrast. Much like lighting, filter selection has historically been guided by loose, subjective patient feedback. The LuxIQ™ resolves this by simulating an exhaustive range of indoor and outdoor long-pass and band-pass filters under steady, calibrated internal lighting parameters, significantly shortening clinical tracking times.
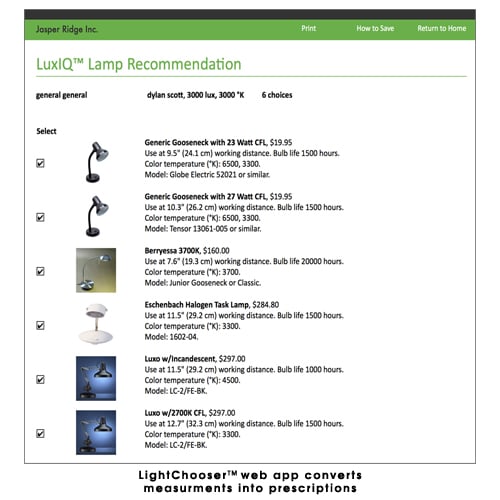
This holds massive value for both the K-12 and 60+ age groups. Student-aged children navigating developmental vision challenges avoid falling behind early in their curriculum when their learning environment is optimized. For our mature populations over 60, biological ocular aging mandates roughly 3X more light for near acuity than what they required as teenagers. When paired with the interactive LightChooser™ web app, the LuxIQ™ framework eliminates consumer confusion, steering the patient directly to the precise commercial lamp or tint profile required to protect their independent lifestyle.
A Scalable Diagnostic Practice Builder
The LuxIQ™ system operates as a true clinic changer. It allows eye care professionals to differentiate their practice profiles by delivering measurable, repeatable solutions for complex low vision cases. Because it demands much less capital overhead than typical specialized diagnostic instrumentation, it achieves rapid return on investment.
Clinicians routinely observe substantial revenue increases across secondary product pipelines—including specialty task lamps, prescription medical filters, and premium polarized sunwear—immediately following the integration of the system. We are incredibly excited to see major academic institutions across the US, Canada, and Europe placing institutional orders so that every low vision rehab specialist has access to their own calibrated system.
The system's high level of variable control allows clinical researchers to document subtle functional correlations that were once impossible to track. A complete repository of these active validation studies can be accessed directly via the Jasper Ridge portal at jasperridge.net/luxiq/studies-talks/.
We purposefully chose to partner with Precision Vision, Inc. for global distribution. As the undisputed world leader in standardized logMAR eye charts—which serve as the critical diagnostic baseline when utilizing our lighting system—Precision Vision’s reputation for quality matches our vision. For technical questions or practice implementation guidance, please connect with me directly at (650) 330-1200 or via email at mklein@jasperridge.net.
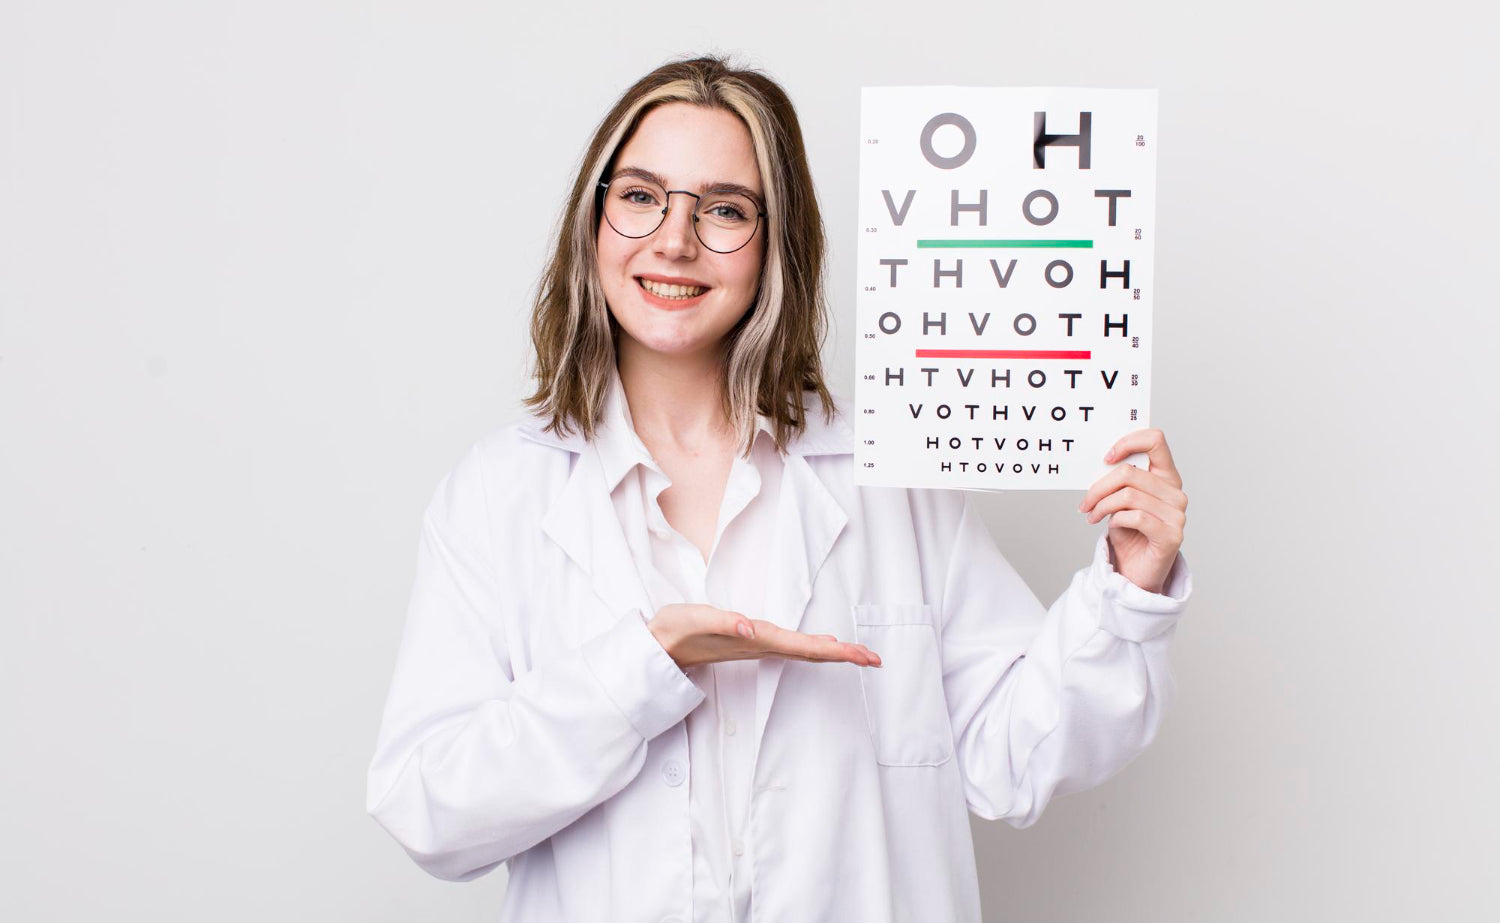
The Colenbrander Mixed Contrast Card Set
As shown in the technical profile, the Colenbrander chart features side-by-side high and low contrast text alignments. This mixed-contrast architecture allows the examiner to measure the distinct slope of a patient's contrast sensitivity curve rapidly without changing testing boards, revealing visual degradation trends instantly.

Each issue we take a look at some of the most frequently asked questions that we receive and feature a clinical Q&A below:
Q: Dear PV, I just purchased your ETDRS cabinet Mixed Contrast Distance Chart for my clinic. However, it did not come with any specific instructions for use. I assume it is to be used with the cabinet illuminated at 2.5 or 4 meters. I did not receive any Low Contrast test recording forms with it, so how should the results be documented?
A: We directed this configuration query to our trusted technical consultant and maven, Dr. August Colenbrander. Below is his structural guidance:
“The left column array of the chart is deployed identically to any standard high-contrast optotype board. When evaluating low vision individuals, I strongly recommend utilizing a fixed 1-meter viewing distance; verifying this with a calibrated distance cord is significantly more accurate than estimating longer lanes. If the baseline resolution permits, the system operates seamlessly at 2.5 meters. Calibrated scaling indices for both 1 meter and 2.5 meters (100 inches) are printed directly along the left and right borders.
If a patient resolves the 5M row at 4 meters, their visual acuity maps as:
$$\text{Visual Acuity} = \frac{\text{Viewing Distance (meters)}}{\text{Letter Size (M-units)}} = \frac{4}{5} = \frac{20}{25}$$
The designated M-units are listed clearly down the center column. If the patient drops 1 or 2 lines when transitioning to the low-contrast column, the performance maps within normal limits. Broader deltas indicate a significant contrast deficit; in severe AMD cases, we regularly capture line drops as high as 10 lines!
This format evaluates the precise SLOPE of the contrast sensitivity curve, fundamentally distinct from capturing peak bounds via Pelli-Robson matrices. Recording requires no specialty paper templates—simply log findings directly into your electronic health record, adding (HC) for high contrast and (LC) for low contrast alongside the row scores (e.g., 20/25 (HC), 20/32 (LC) indicating normal parity, versus 20/25 (HC), 20/63 (LC) highlighting an abnormal 4-line drop). This configuration eliminates chart-swapping downtime while rendering the visual deficit immediately obvious to the patient and their family.”
