


May 2015
Drs. Legge and Massof Receive the Helen Keller Prize
Honoring Visionary Pioneers in Low-Vision Frameworks and Architectural Design Standards


Dr. Gordon Legge (left) and Dr. Robert Massof (right), Helen Keller Prize Recipients
Celebrating International Vision Research Excellence
Precision Vision extends its warmest congratulations to Dr. Gordon Legge, creator of the MNREAD Chart, and Dr. Robert Massof for being selected as this year’s distinguished recipients of the prestigious Helen Keller Prize for Vision Research. Presented at the annual Association for Research in Vision and Ophthalmology (ARVO) gathering, the prize was established in 1994 to recognize exceptional contributions to sight preservation.
The Prize Selection Committee comprises world-renowned scientists and clinical research physicians who stand as leading figures in the international ophthalmic community. Through this recognition, the Helen Keller Foundation for Research and Education aims to focus global attention on the critical need to support vision research, securing the precious gift of sight for future generations.

I want to extend a sincere THANK YOU to everyone who took the time to visit Amy and me at our exhibition booth in Denver during the recent ARVO meeting. As always, this symposium tops our list of favorite annual gatherings, serving as an energized forum for our team.
During the event, we even received an engaging historical briefing from Dr. Robert Enzenauer, MD, on the adaptive reasons why early maritime pirates wore eye patches—a discussion sparked by the selection of our pediatric Patti Pics® optotypes for the innovative Penny the Pirate project!
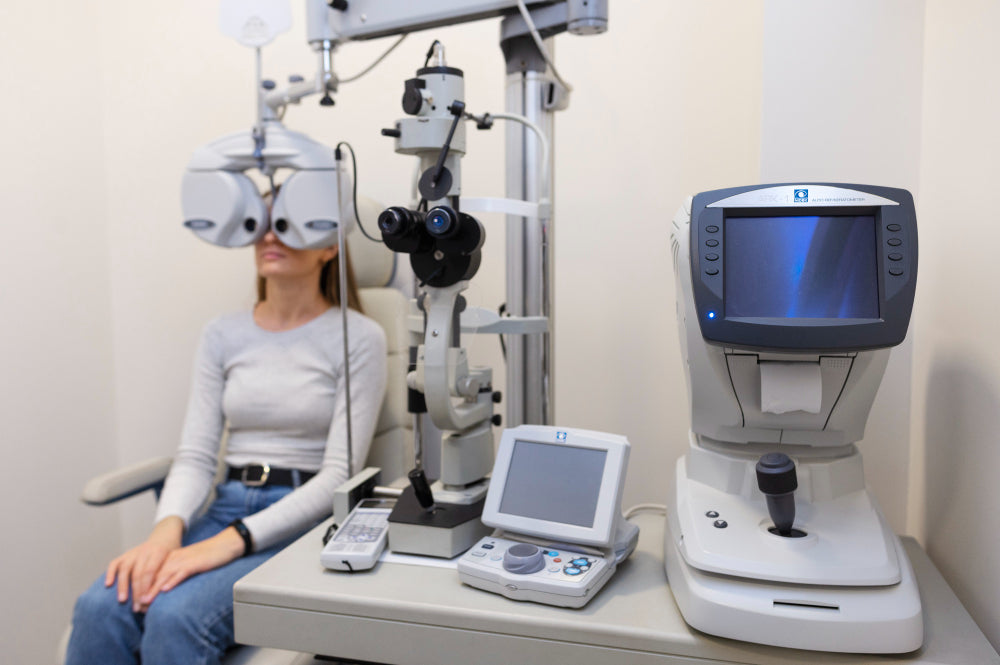
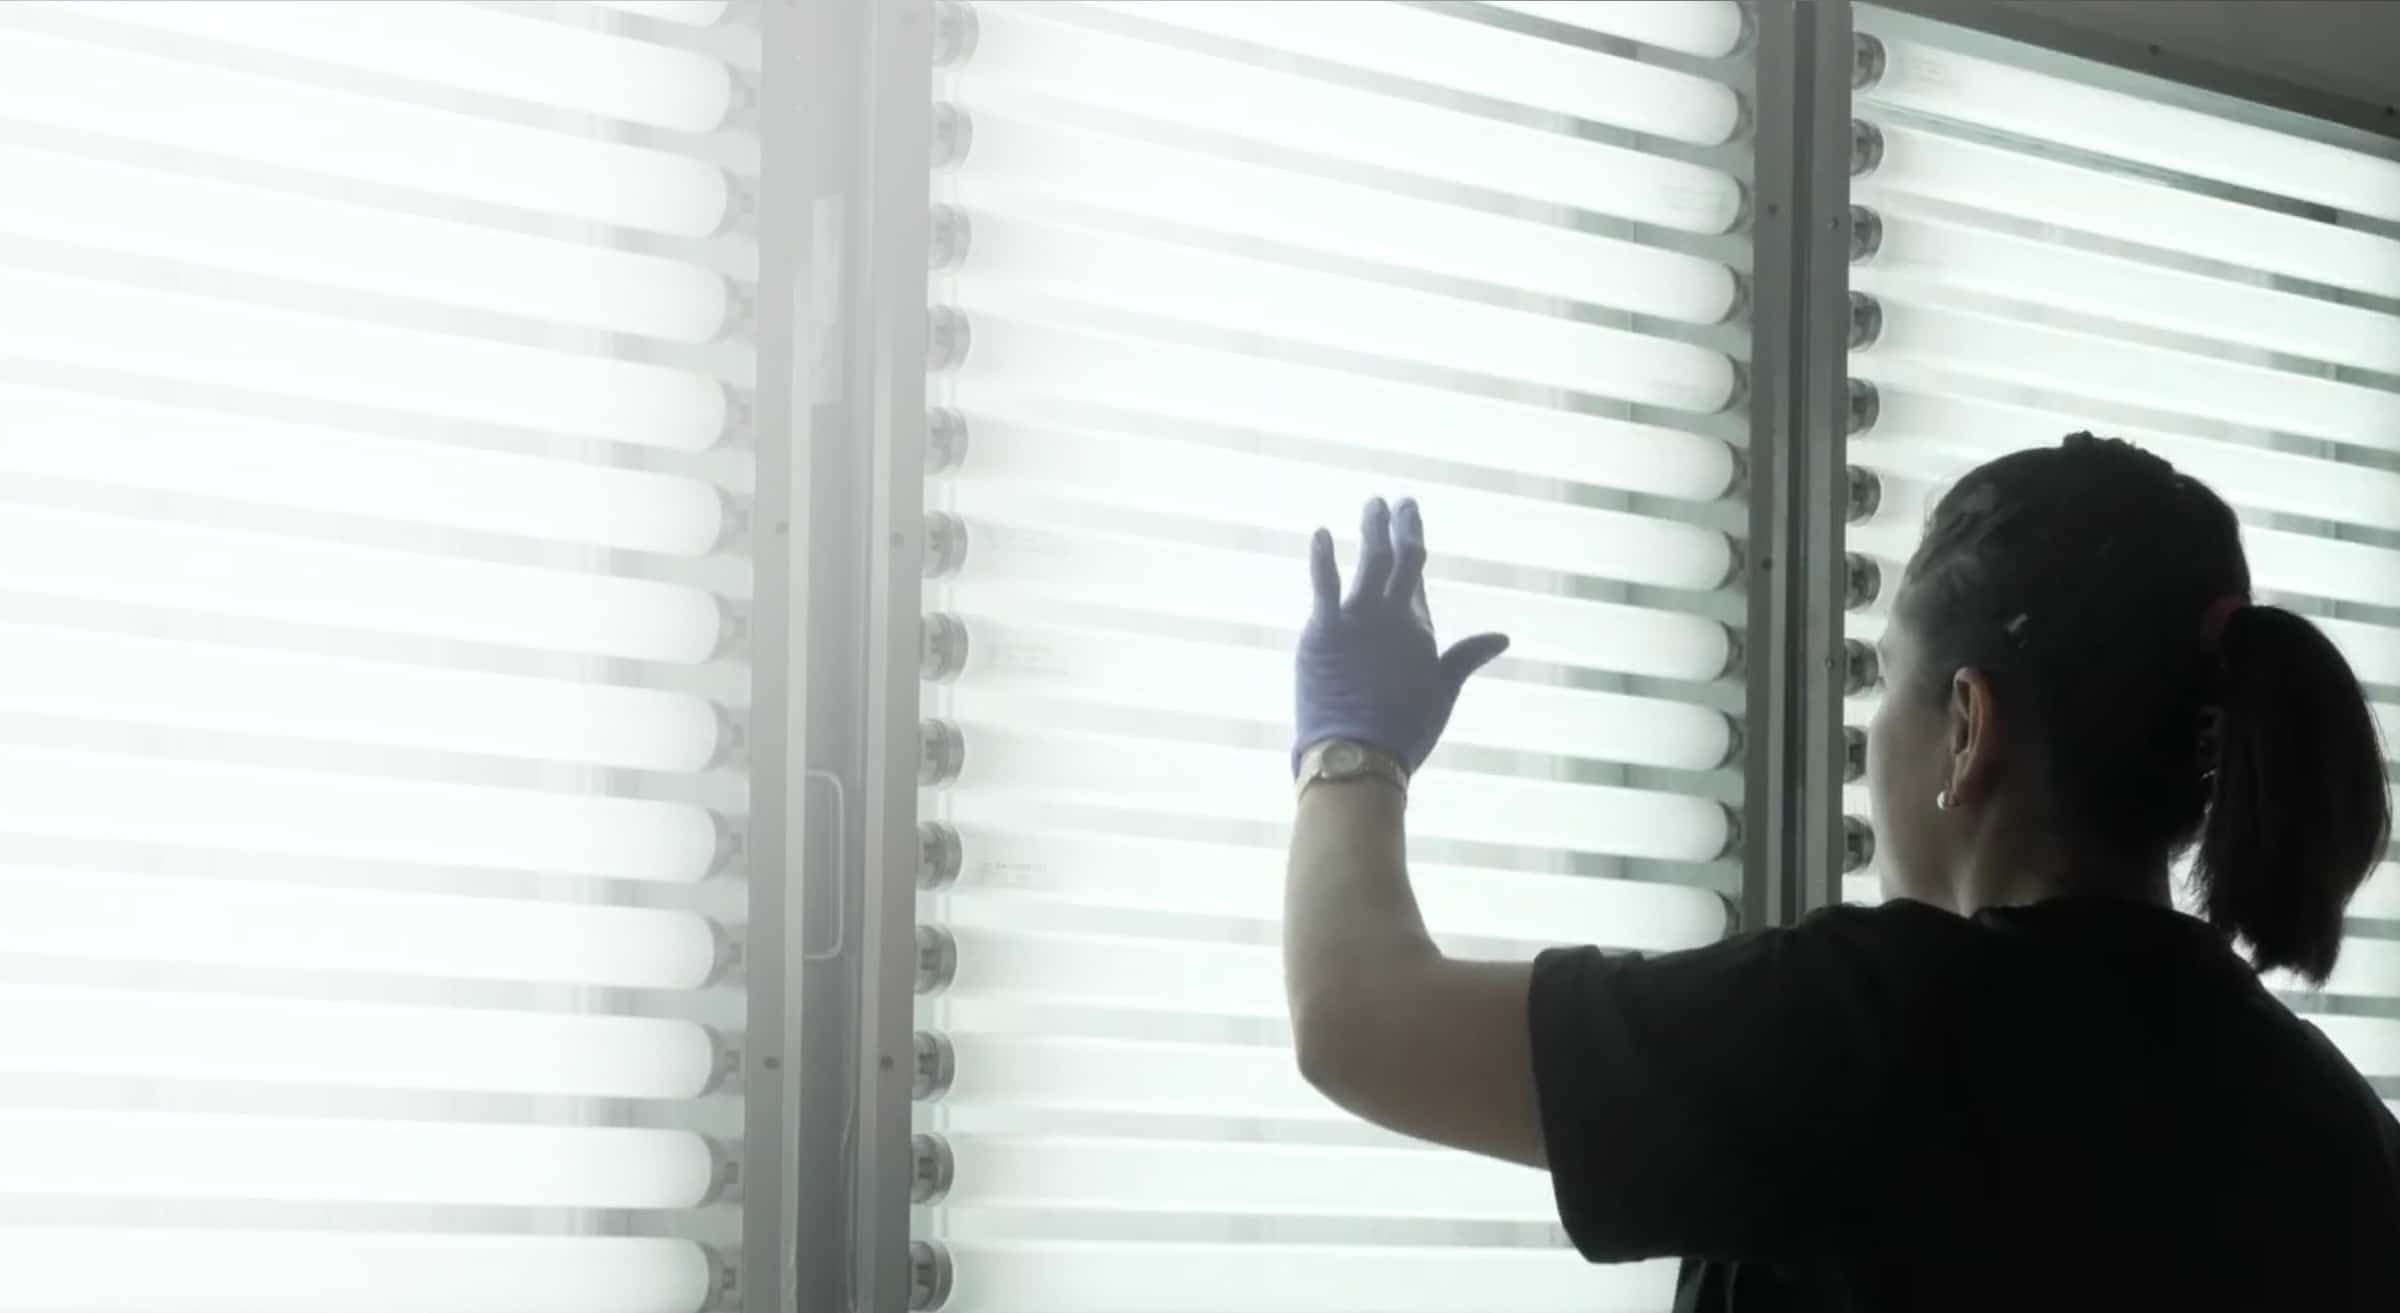
Our new LED ETDRS Illuminator Cabinet enjoyed an exceptionally warm reception. Its structural engineering, uniform luminance stability, and robust construction earned a unanimous two-thumbs-up endorsement from dozens of vision specialists, including regulatory personnel at governmental agencies whose validation criteria are highly relevant.
Furthermore, many visitors focused intense interest on the LuxIQ™ system, identifying it as an elite, practical device to modulate near task lighting for clinical trials. We are honored to be tapped for several groundbreaking research projects that will challenge and inspire us over the coming months.
Ed Kopidlansky Jr., President • Precision Vision
P.S. Curious about the pirate patch dark-adaptation mechanism? Click here to read Eye Fact #6 in our archived healthy vision brief.

National Eye Institute Guidelines
In celebration of Healthy Vision Month, our technical team scoured verified ophthalmic databases to aggregate ten fascinating visual milestones for your clinical enjoyment and edification:
- Aboriginal Visual Acuity: The highest human visual acuity ever documented was measured in an Australian Aborigine man, registering an incredible metric score of 6/1.5. This implies he could accurately resolve small optotype details at a distance of 6 meters that a person with standard vision could only decode from 1.5 meters away.
- Avian Sizing Scaling: An eagle possesses a visual resolution threshold mapping around 20/4. Objects that a human with perfect vision can only see clearly at 20 feet are resolved with equal clarity by an eagle from a distance of 100 feet.
- Vestibulo-Ocular Auto-Stabilization: Our eyes employ an instantaneous, imperceptible reflex that blocks motion blur during rapid locomotion. Johns Hopkins Medicine neural research details how wire-like retinal projections precisely self-plug into targeted cortical maps to drive this autostabilization.
- Anatomical Complexity: The human visual organ is synthesized from over 200 million separate internal parts working in synchronized neurological alignment.
- Sensor Megapixel Parity: If the biological eye were modeled as a modern digital sensor array, its static angular resolution would equal a staggering 576 megapixels.
- Pirate Dark-Adaptation Cues: Maritime pirates wore eye patches to keep one eye permanently dark-adapted. This allowed them to transition instantly from blazing above-deck sunlight to near-pitch darkness below-deck without waiting for chemical rhodopsin regeneration.
- Cilia Lifespan Tracks: The cumulative length of all eyelashes shed by an average human over their lifespan exceeds 98 feet, with each individual lash carrying an average operational lifespan of roughly 5 months.
- The Carrots Misinformation Myth: The widespread cultural belief that eating carrots directly upgrades eyesight was actually a highly successful WWII disinformation campaign engineered by British Intelligence to mask their new airborne R.A.D.A.R. intercept technology from opposing forces.
- VDT Workstation Stress: Standard corrective lenses are frequently inadequate to manage the specific focal depths of computer Video Display Terminals (VDTs). Specialized occupational variable lenses are often required to mitigate computer vision syndrome.
- Pediatric Screening Targets: AAPOS mandates that comprehensive infant vision screenings should initiate as early as 3 months of age, particularly if tracking deficits are noted, an abnormal red reflex is observed, or a parental history of retinoblastoma exists.

Each issue we take a look at some of the most frequently asked questions that we receive and feature a clinical Q&A below:
Q: Early contrast sensitivity testing relied extensively on sine-wave gratings; however, in 1988, Pelli and Robson introduced a chart based entirely on letter recognition thresholds. Which method is preferred for clinical and research applications?
To deliver an exhaustive, multi-faceted answer to this long-standing clinical debate, we polled three of the world’s most renowned experts on contrast sensitivity psychophysics: Dr. August Colenbrander, Dr. John Robson, and Dr. Ian Bailey.
August Colenbrander, MD: Edge Detection & ADL Prediction
Early human contrast research borrowed mathematical concepts from the design of industrial camera lens systems. For purely optical modeling—such as analyzing corneal aberrations or correcting complex refractive errors—sinusoidal waveforms are highly favored due to their clean integration into Fourier transform calculations.
However, when we broaden our scope to evaluate the complete biological visual system and actual visually guided behavior, we must account for neural processing cascading through the retina and into the visual cortex. Repetitive, fuzzy-edged patterns like sine-wave gratings are common in engineering laboratories but practically non-existent in natural scenes. It is highly unlikely that neural architecture evolved to process sine-waves.
The primary evolutionary function of the retina is edge detection and edge enhancement. Consequently, detecting sharp optotype borders—as featured on the Pelli-Robson and Mars charts—aligns closely with the neural interpretation of natural forms, serving as a significantly better predictor of a patient's capacity to perform Activities of Daily Living (ADL).
John Robson, MA, PhD, ScD: Efficiency and Forced-Choice Reliability
Mapping a subject's contrast sensitivity function (CSF) via sine-wave gratings across multiple spatial frequencies provides valuable descriptive data. However, there is minimal evidence that this time-consuming approach yields a clinically more useful diagnostic profile than combining a standard visual acuity score with a rapid contrast chart designed to target the peak of the human contrast sensitivity curve.
While it is theoretically possible to capture peak sensitivity using a single grating patch of optimized spatial frequency, grating patterns do not adapt well to the rapid, robust psychophysical testing rules required in a busy clinic.
Maximum measurement robustness and speed are achieved via a "many-alternative forced-choice" method, which forces the patient to identify a target from multiple alternative options. This protocol is effortlessly driven by utilizing letters of a fixed, large angular size with which patients are deeply familiar. Hermann Snellen recognized this paradigm when designing the first acuity lines. The integration of this 10-alternative forced-choice letter identification method is what directly accounts for the exceptional reliability and low test-retest variance seen in the Pelli-Robson and Mars charts.
Ian Bailey, OD, MS, FBCO, FAAO: Mobility, Orientation, and Sharp Visual Edges
There is a special mathematical elegance to analyzing visual scenes in terms of Fourier sinusoidal components and using an observer’s CSF curve to predict how a landscape will be perceived. However, this classic linear model frequently breaks down when trying to predict the real-world functional difficulties of patients suffering from neural pathway damage or macular degeneration.
The primary real-world challenges low-contrast patients experience are tied directly to spatial orientation and mobility. Safely detecting obstacles, stepping over curbs, and navigating pathways depends entirely on the visual resolution of clear boundaries or borders. Therefore, contrast sensitivity tests should evaluate thresholds for edge detection, meaning the targets must feature sharp visual margins.
The widely implemented Pelli-Robson and Mars tests accomplish this by utilizing letters or numbers of massive angular size. With these configurations, the contrast threshold for object detection is nearly identical to that for cognitive recognition. If a patient can see that an object is present, they can easily recognize its shape. Testing with low-spatial-frequency sinusoidal targets can help evaluate specific tasks—such as noticing gradual undulations on a concrete walkway—but deploying sharp-edged optotype charts provides broad clinical relevance for predicting actual daily mobility performance.


%20and%20...)