


ETDRS Charts
ETDRS Charts for Standardized Visual Acuity Testing
Precision Vision ETDRS charts are designed to support reliable, reproducible visual acuity assessment across ophthalmology research, clinical trials, and patient care environments.
Built around standardized logMAR methodology, our ETDRS charts help researchers and clinicians reduce variability while supporting consistent visual function measurement across sites, investigators, and testing environments.
The Gold Standard in Visual Acuity Testing
ETDRS charts have become the industry standard for visual acuity assessment in ophthalmology research and clinical trials because of their standardized letter progression, equal spacing, and consistent logarithmic scaling.
Engineered to Support
Precision Vision ETDRS charts are engineered to support:
- Reliable visual acuity measurement
- Standardized testing conditions
- Reduced examiner variability
- Clinical trial consistency
- Reproducible visual endpoints
- Regulatory confidence
Top-selling ETDRS Charts
View all in ETDRS →The most-ordered ETDRS solutions across our clinical trial and practice customers.
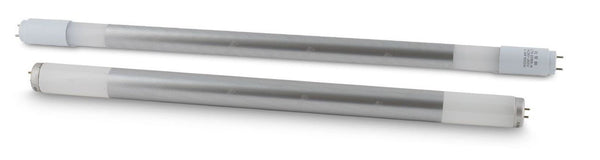
Replacement Bulbs (Set) for ETDRS® Illuminator Cabinet
From$92.00
Original Series Sloan Letter ETDRS®
$69.75
Revised Series Sloan Letter ETDRS®
$69.75
Calibrated Dual-Range Light Meter (Lux and Foot-Candles)
$199.50
5 Leg Caster Base
From$364.25
ETDRS® Original Illuminator Cabinet with LED Bulbs
$1,550.00Designed for Clinical Trials and Research
In multi-site clinical trials, small inconsistencies in visual acuity testing can introduce variability that impacts endpoint reliability. Precision Vision ETDRS charts are designed to help support:
- Consistent visual acuity assessment across study sites
- Standardized testing protocols
- Reliable longitudinal patient monitoring
- Global deployment readiness
- Regulatory-grade documentation and traceability
Our ETDRS systems are utilized by sponsors, CROs, academic institutions, and ophthalmology research teams worldwide.
Why logMAR Matters
Unlike traditional Snellen charts, ETDRS charts use standardized logarithmic progression and spacing designed to support more precise and reproducible visual acuity measurement.
- Equal letter spacing
- Consistent progression between lines
- Improved scoring precision
- Enhanced reproducibility
- Better sensitivity to clinical change
This level of standardization makes ETDRS testing the preferred methodology for many ophthalmic clinical studies.
High Contrast and Low Contrast ETDRS Testing
Precision Vision offers both high-contrast and low-contrast ETDRS charts to support broader functional vision assessment.
High Contrast ETDRS Charts
Designed for standardized visual acuity assessment in routine ophthalmology and clinical research.
Low Contrast ETDRS Charts
Support assessment of subtle visual function changes often associated with retinal, neurologic, and low vision conditions.
Ready to source ETDRS charts for your study or practice?
Browse the full Precision Vision ETDRS catalog or talk with a specialist about your protocol.
Frequently Asked Questions
What is an ETDRS chart?
An ETDRS chart is a standardized logMAR visual acuity chart commonly used in ophthalmology research and clinical trials to support consistent vision measurement.
Why are ETDRS charts used in clinical trials?
ETDRS charts help reduce variability in visual acuity assessment by using standardized letter progression, spacing, and scoring methodology.
What is the difference between ETDRS and Snellen charts?
ETDRS charts use a standardized logMAR format designed for greater precision and reproducibility, while Snellen charts use variable letter spacing and progression.
Does Precision Vision offer low-contrast ETDRS charts?
Yes. Precision Vision offers both high-contrast and low-contrast ETDRS charts designed for clinical research and functional vision assessment.
Who uses Precision Vision ETDRS charts?
Precision Vision ETDRS charts are used by ophthalmologists, optometrists, sponsors, CROs, academic institutions, and vision researchers worldwide.