


Precise Eye Charts - We are all about Precision and Quality Control - Precision Vision
The Direct Impact of Inkjet Precision
Why Manufacturing Tolerances Define the Integrity of Pediatric and Research Acuity Thresholds
As a vision care professional, you understand that standardized testing guidelines are only as reliable as the physical charts used to implement them. Securing consensus across international ophthalmic committees regarding chart geometry can require years of collaborative vetting. Yet, if identical rigor isn't poured directly into the print engineering phase, data fragmentation is inevitable.
This vulnerability is glaringly obvious within school-aged pediatric screenings. Without unyielding controls, a school district in one township may deploy distorted, poorly inked optotypes that fail to match the resolution threshold of a district down the street. Shaving a few pennies on a chart profile compromises public health data, directly impacting early amblyopia interception.
The Open-Domain Risk: While the Landolt C was established as the baseline international calibration symbol in 1909, the Tumbling E holds dominant popularity among pediatric clinicians. Because the Tumbling E configuration exists in the open public domain, unvetted international manufacturers frequently duplicate it with poor geometric precision.
Visit Precision Vision Portal
Standardized thresholds protect early binocular tracking pathways
Unmasking Optotype Distortion: Precision vs. Imitation
To preserve accurate patient recognition thresholds, every optotype row must maintain a strict $5\times5$ stroke-to-height ratio, crisp borders, and uniform edge definitions. When charts are sourced from unvetted international suppliers, ink bleeding, rounded stroke intersections, and unstable spacing contours routinely make their way into clinical toolkits.
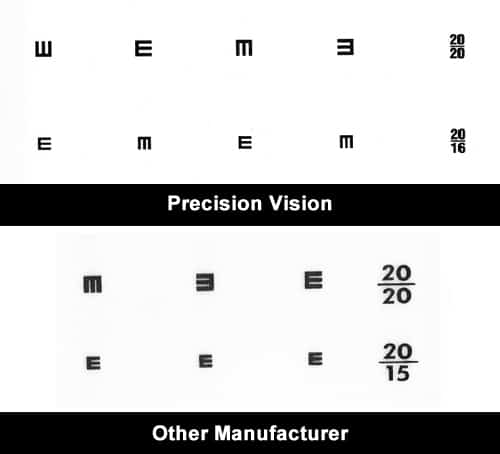
Visual Calibration: The Precision Vision® Tumbling E matrix (top) vs. a distorted alternative layout (bottom)
Our precise manufacturing controls would never allow an unstable or poorly binned product to leave our facility. Precision Vision® products are built to last, highly cost-effective, and engineered to serve as definitive standards worldwide. From high-contrast logMAR letter blocks and pediatric symbol sets to specialized low-contrast matrices, grating acuity, and preferential looking cards, our commitment to absolute geometric uniformity remains total.
We supply a diverse range of test distances and specialized optotypes, including our proprietary, peer-validated **Patti Pics™ pediatric symbols**, ensuring your clinical trial parameters or daily school screenings generate perfectly reproducible data.
Price: $25.00 per specialized chart.
Sloan Two-Sided ETDRS Format Near Point Chart
This double-sided near point diagnostic chart incorporates highly calibrated Sloan optotypes that adhere strictly to the traditional Snellen $5\times5$ grid, ensuring equal blur thresholds, identical legibility weights, and uncompromised row difficulty. Engineered in an authentic ETDRS layout on both faces, each side features an entirely scrambled configuration of characters to facilitate repeatable, highly reliable near-point tracking.
Sloan Multiple Group Near Vision Card (Single-Sided)
Patient memorization shortcutting is a major source of error that alters acuity scores and compromises clinical documentation integrity. This single-sided near card counteracts memorization bias by presenting multiple independent optotype groups across identical line sizes. This structural isolation design ensures pristine, repeatable threshold logging over extensive multi-test evaluations.
Share Your Clinical Case History and Story Narratives
Precision Vision® wants to hear from your practice team. Tell us how your diagnostic lane configurations or screening programs are advancing visual health benchmarks. Do you have an interesting field deployment narrative, validation highlight, or unique workflow case history involving a Precision Vision® chart product?
Submit Narrative to Editorial Desk
